GALEX TDS Alerts Archive: January 2010

Archive Navigation: Monthly Archive | Current

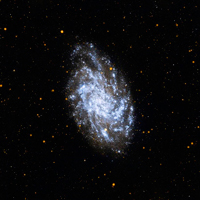
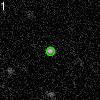
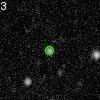
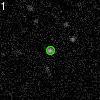
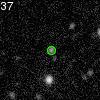
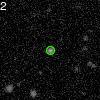
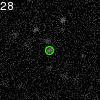
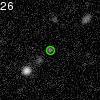
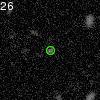
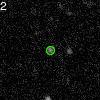
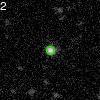
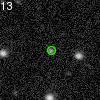
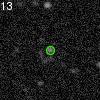
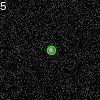
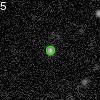
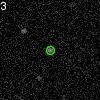
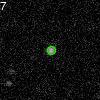
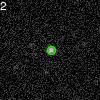
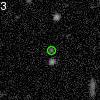
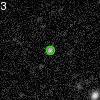
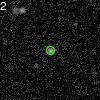
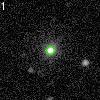
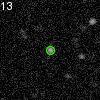
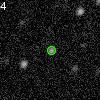
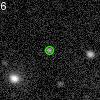
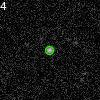
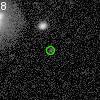
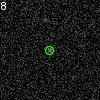
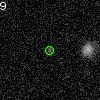
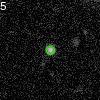
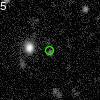
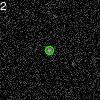
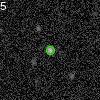
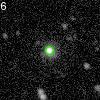
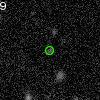
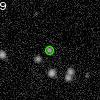
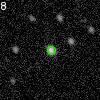
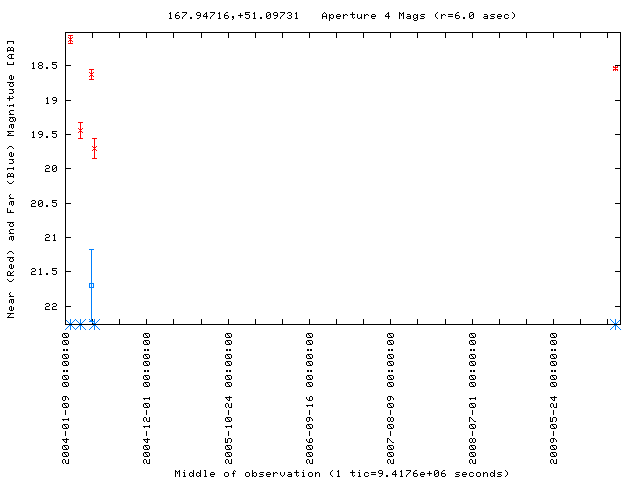
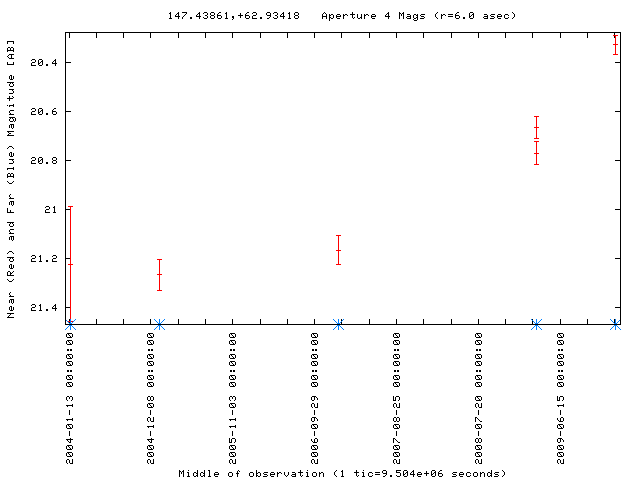
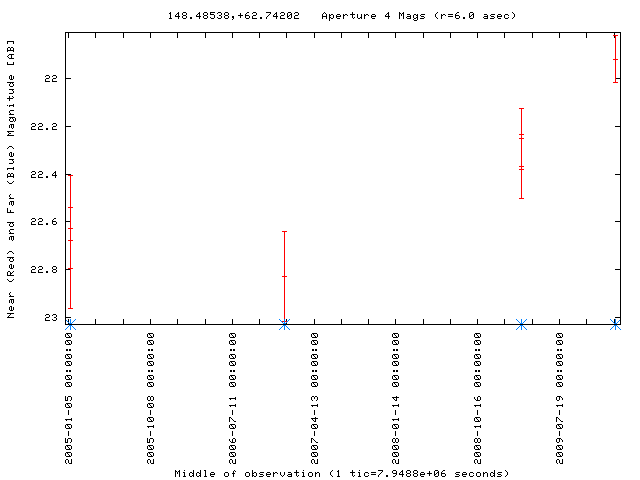
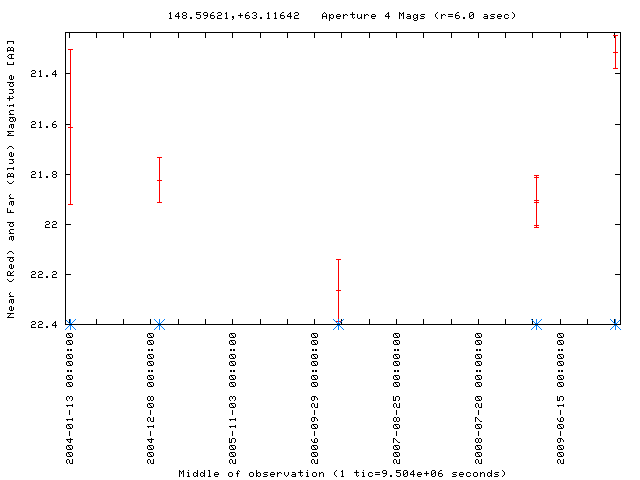
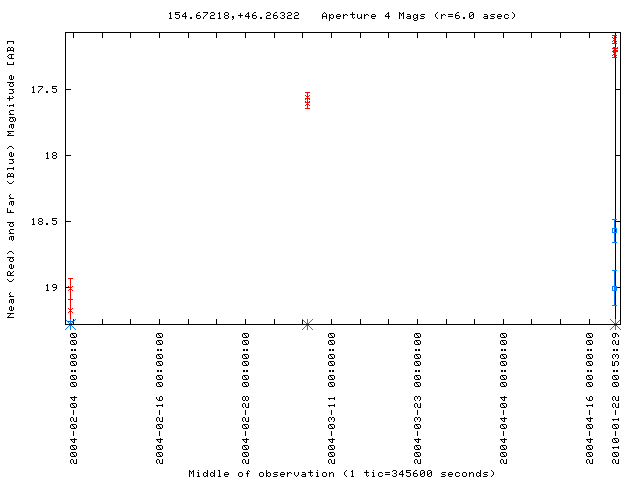
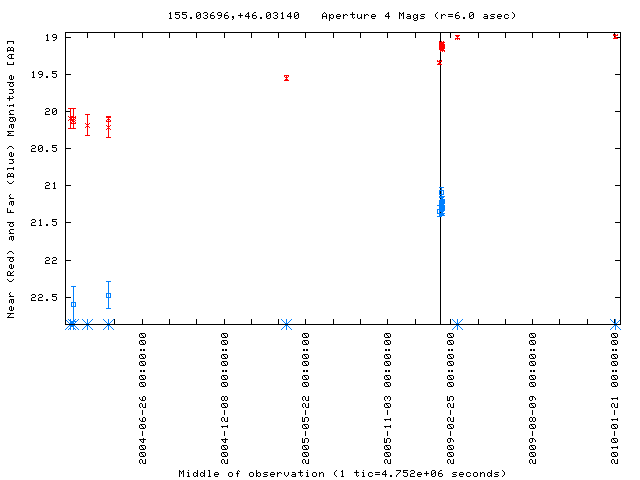
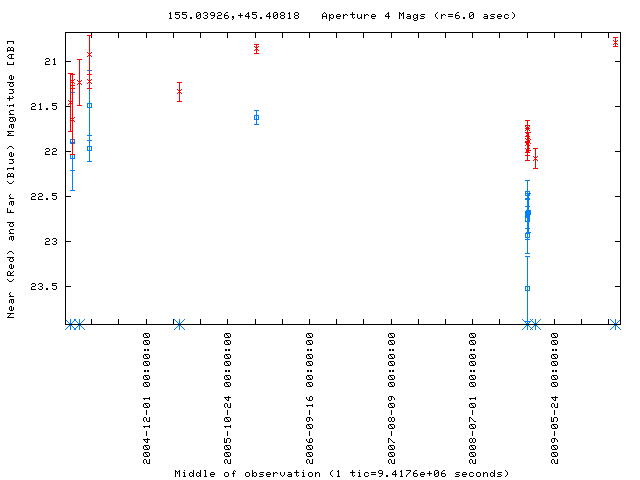
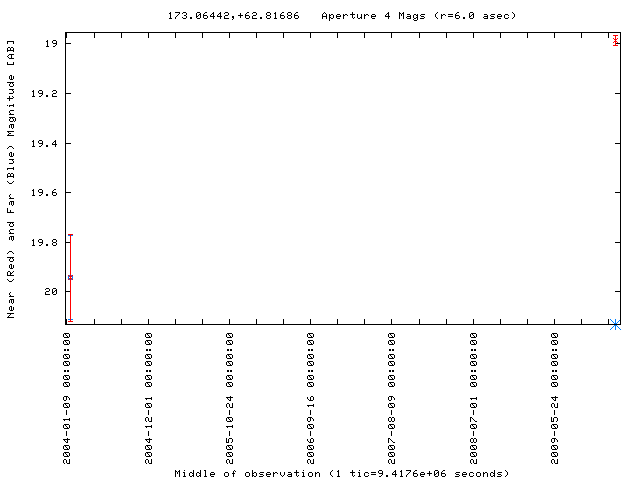
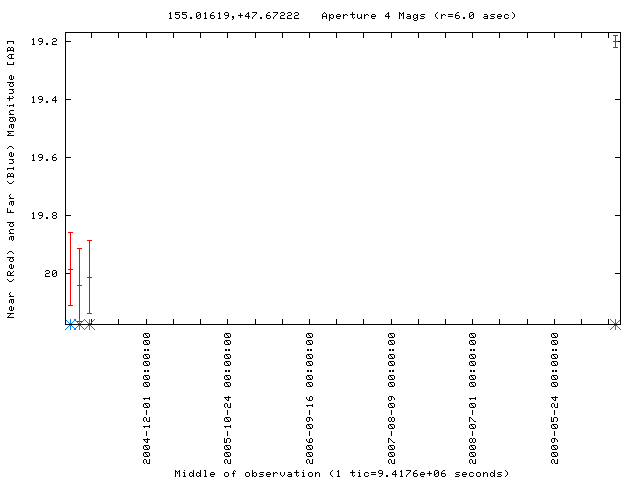
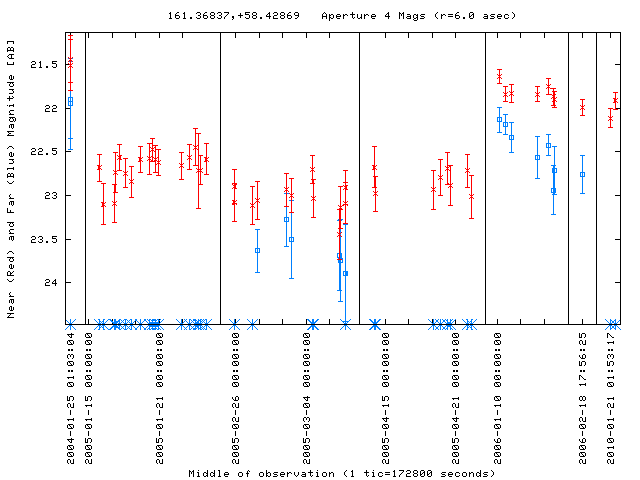
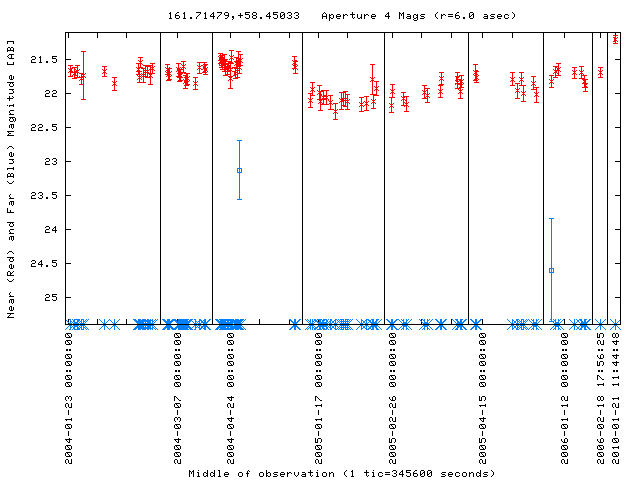
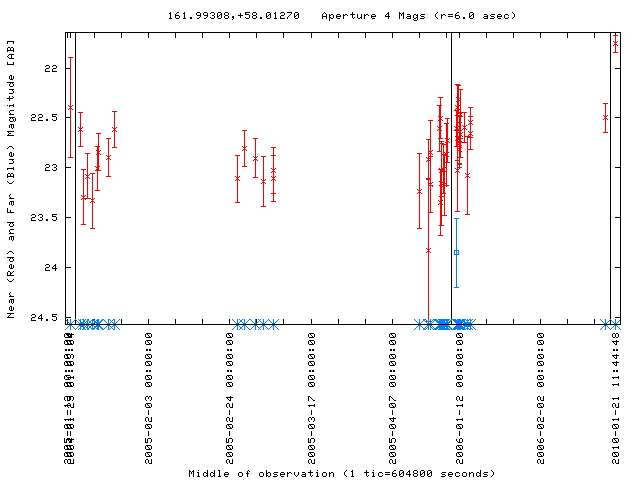
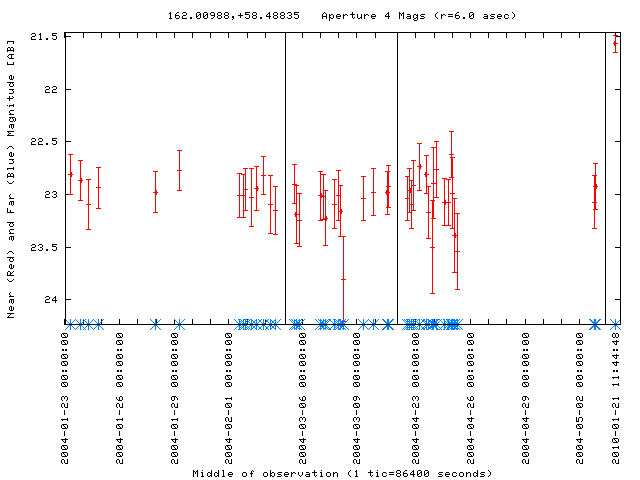
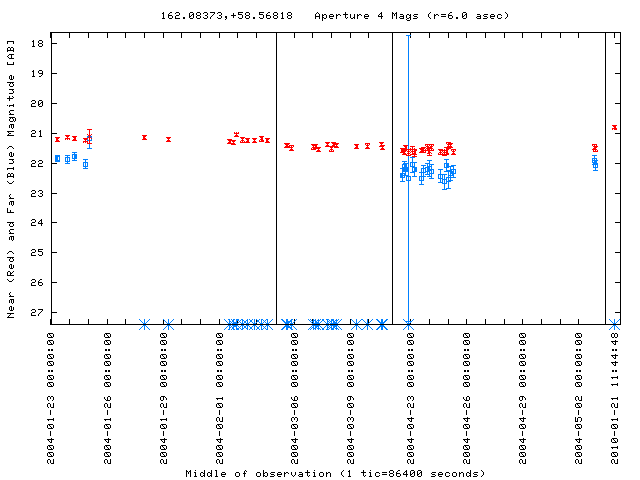
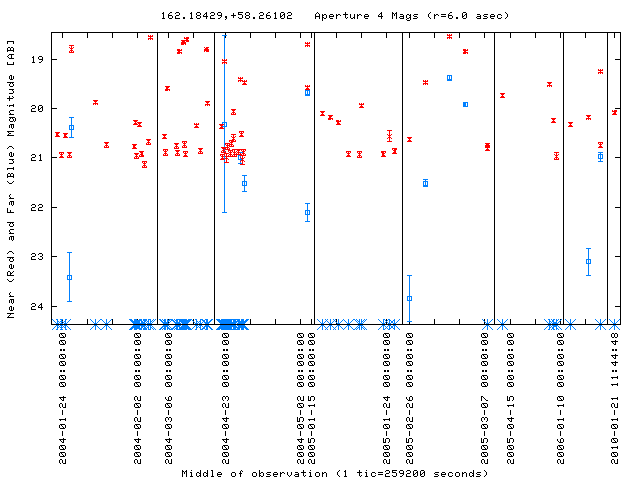
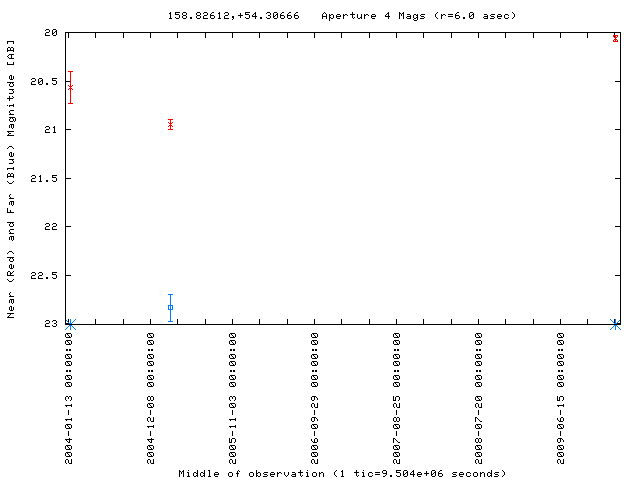
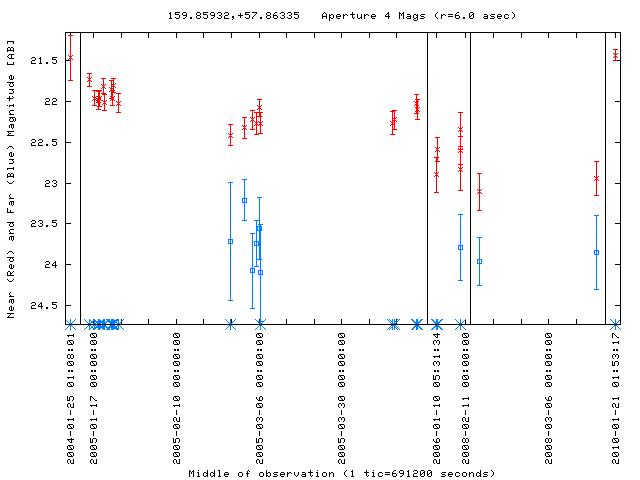
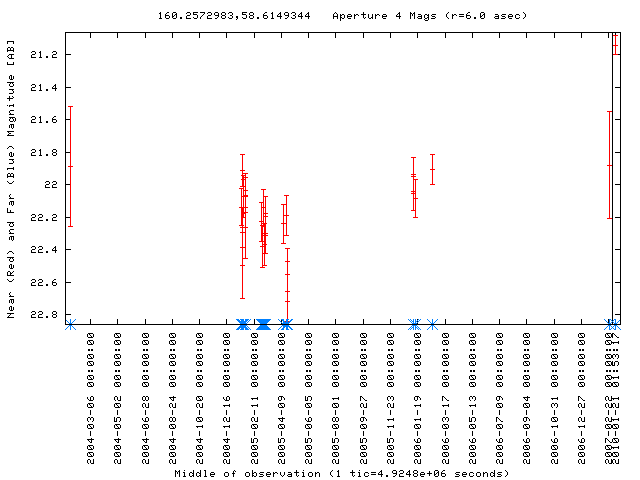
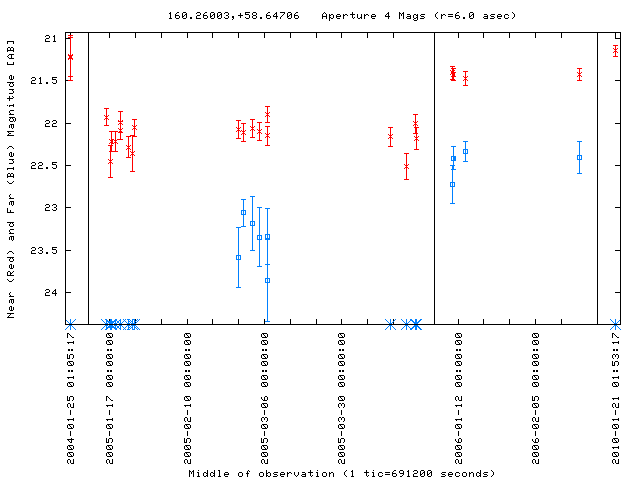
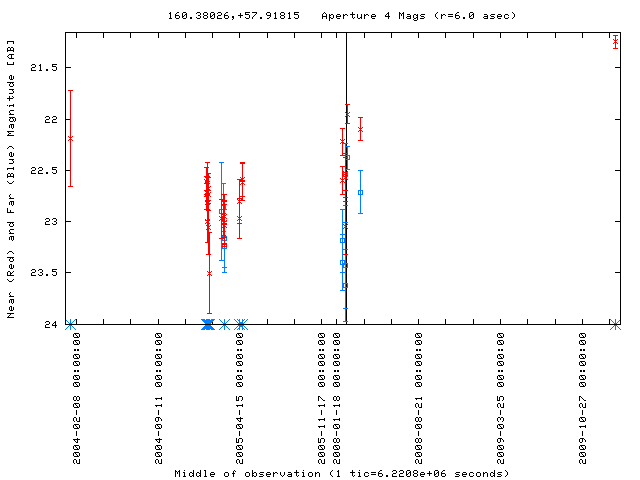
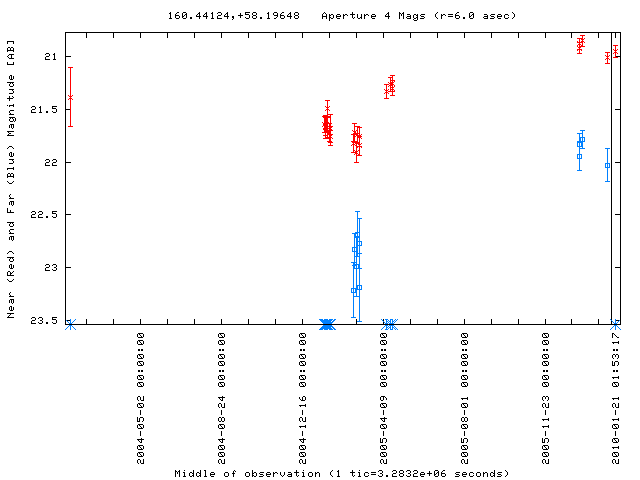
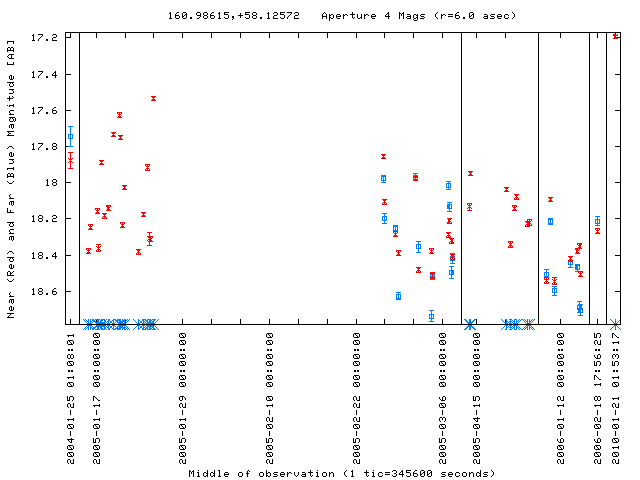
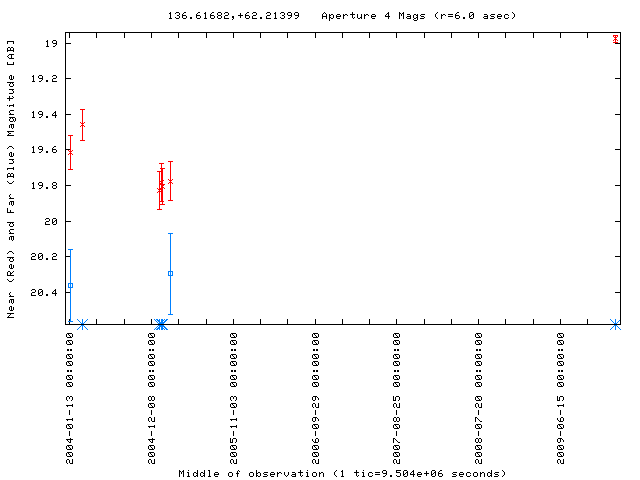
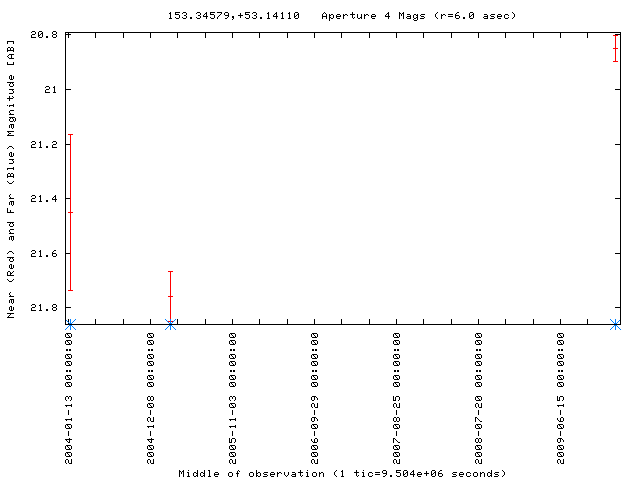
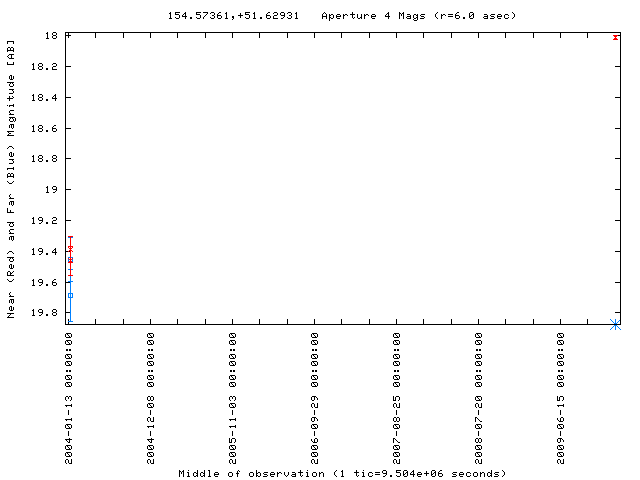
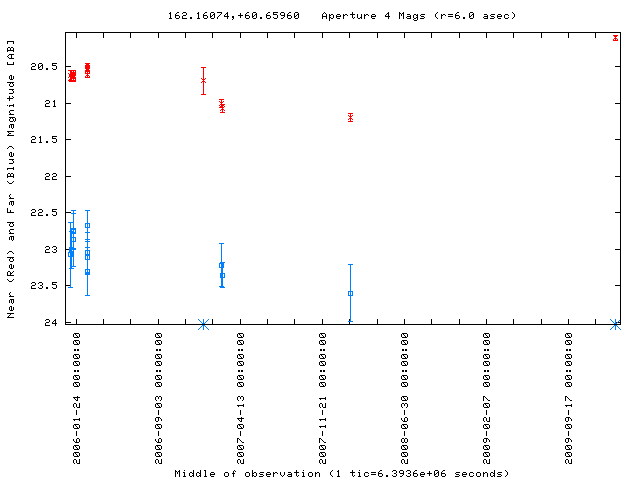
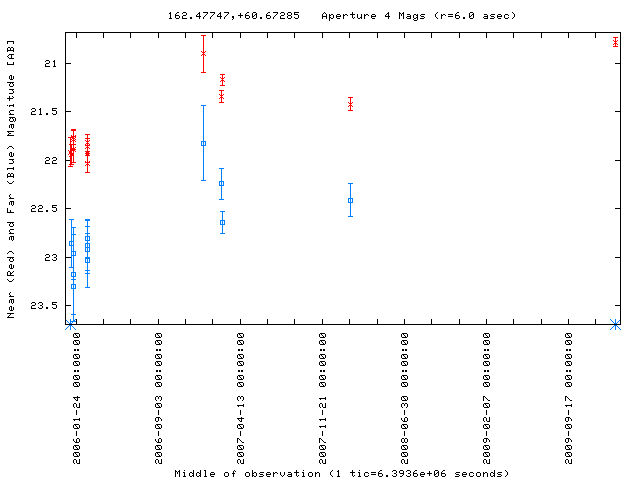
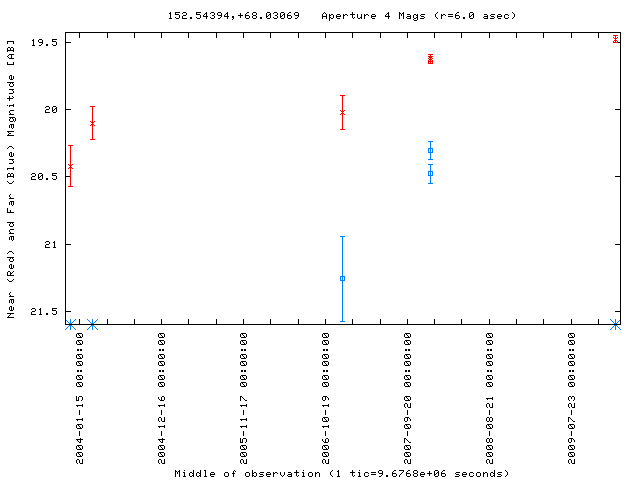
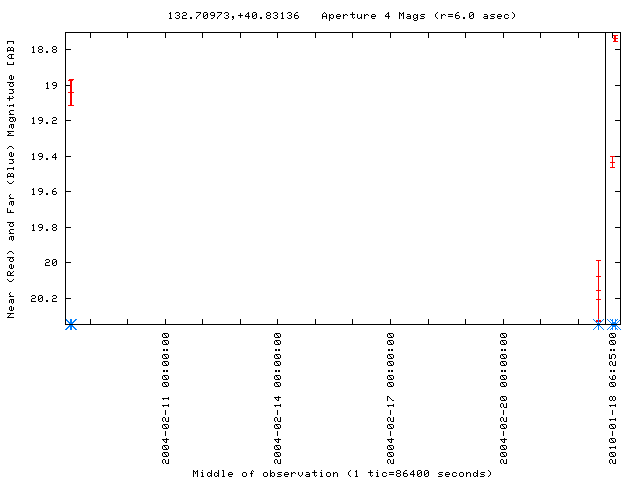
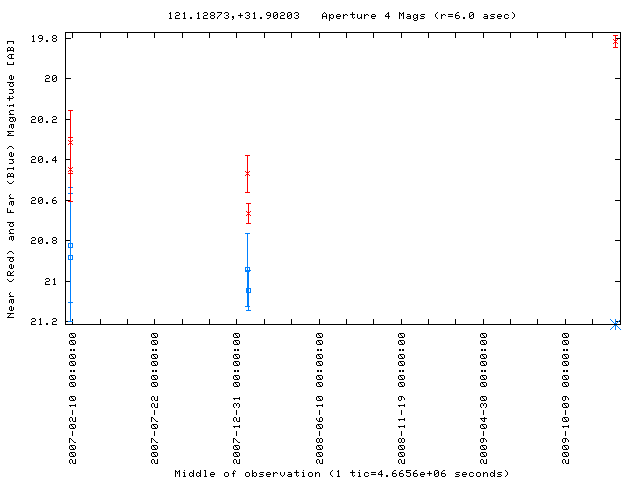
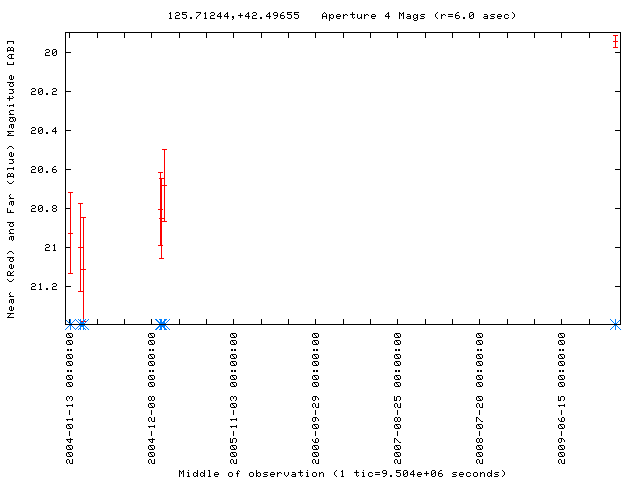
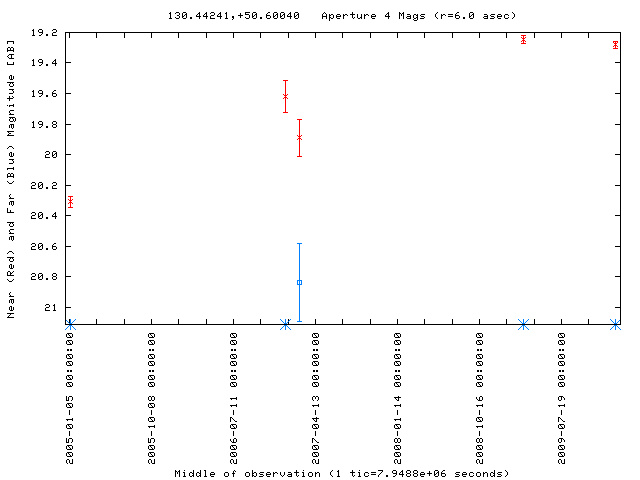
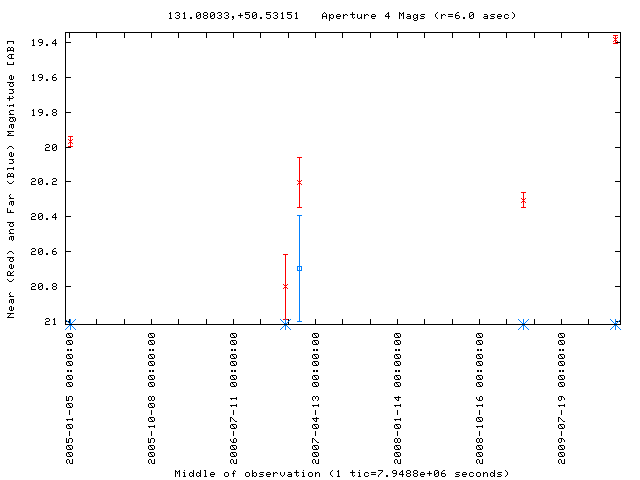
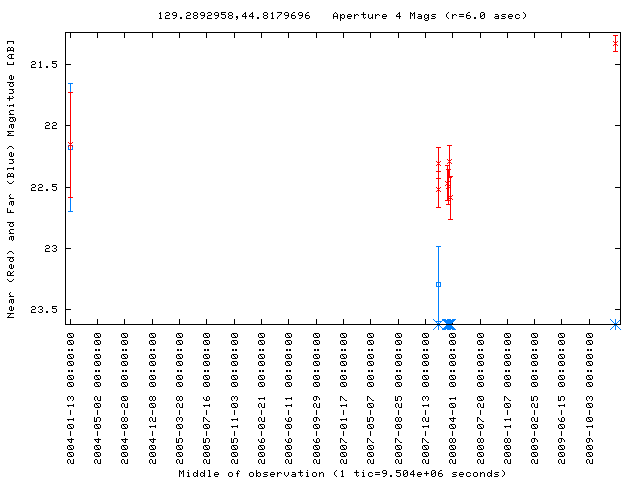
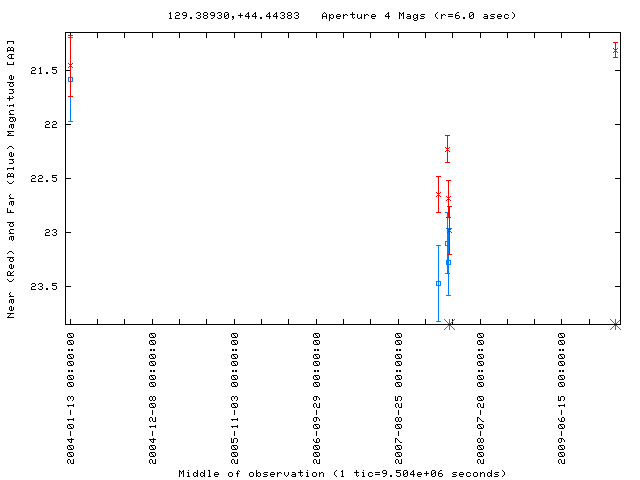
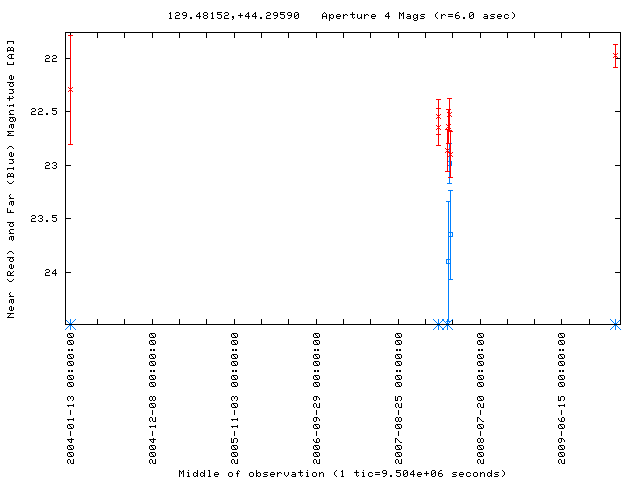
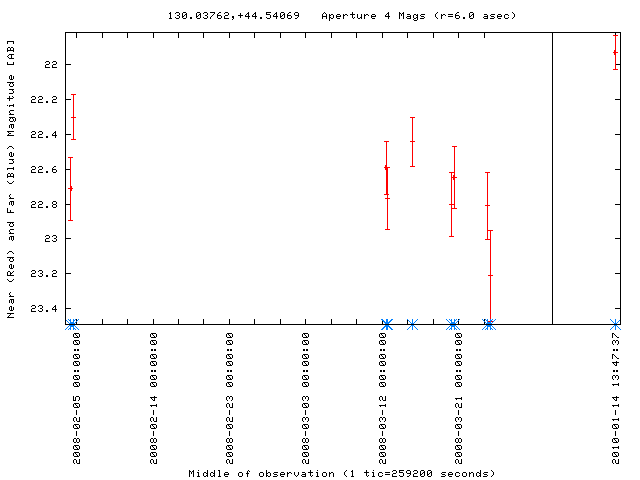
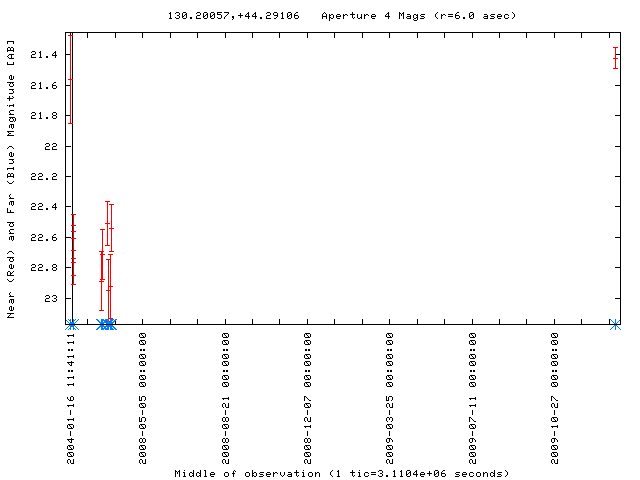
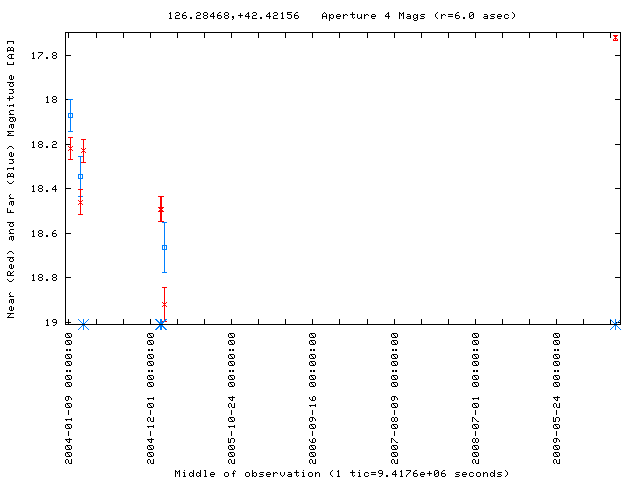
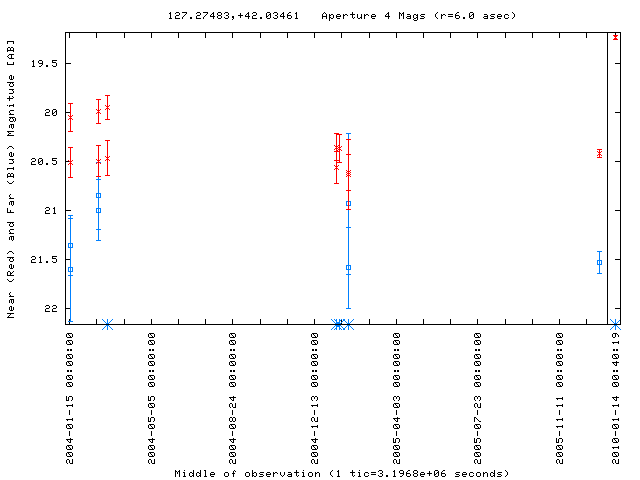
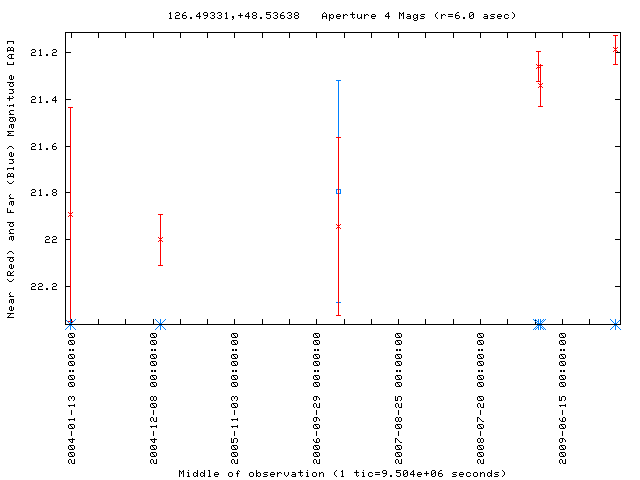
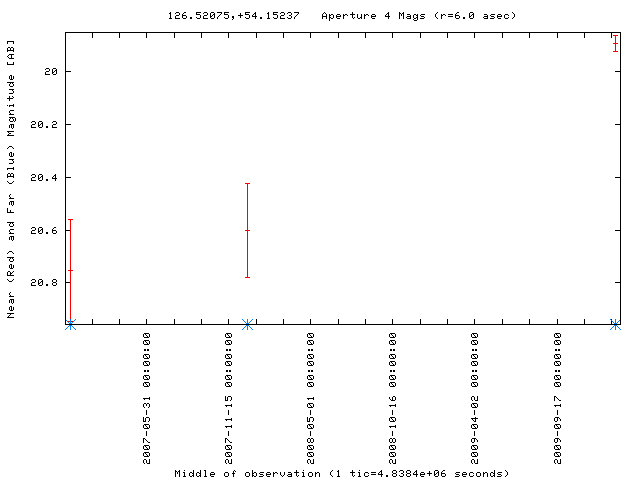
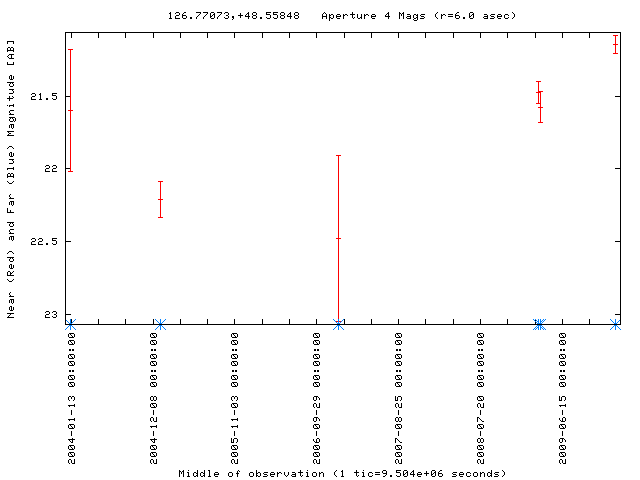
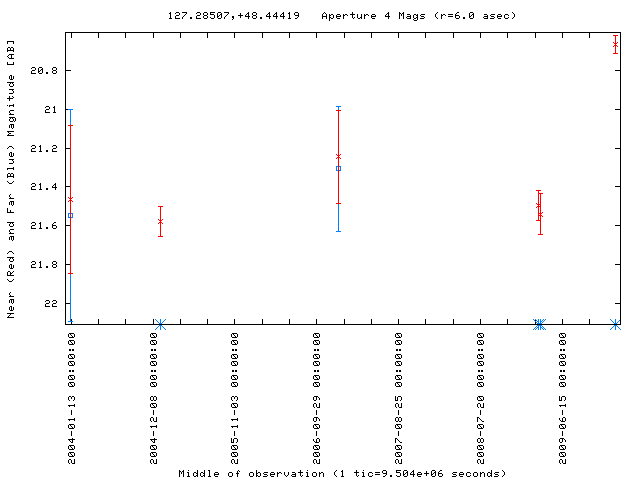
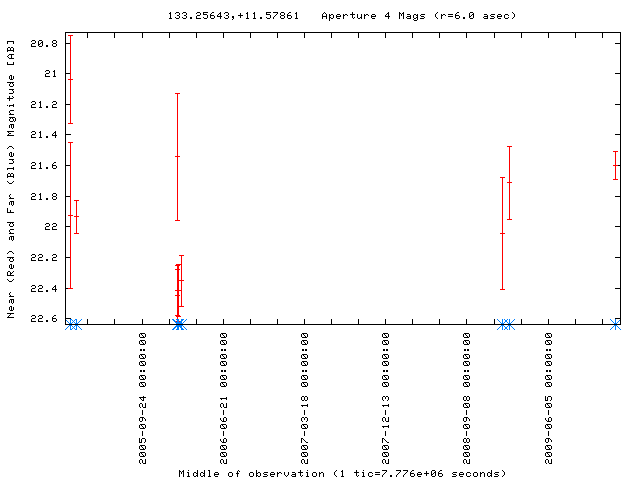
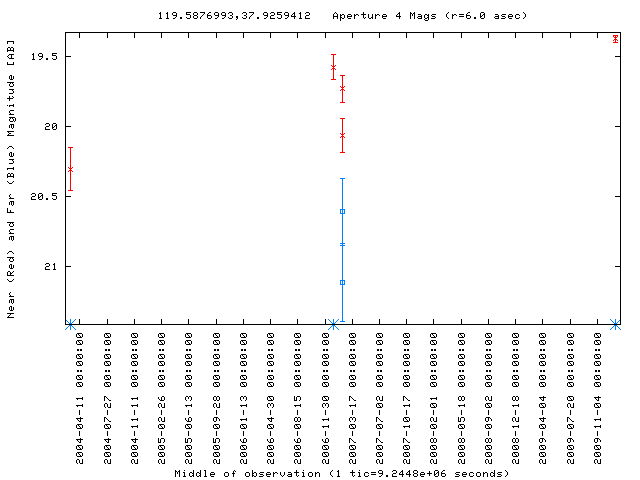
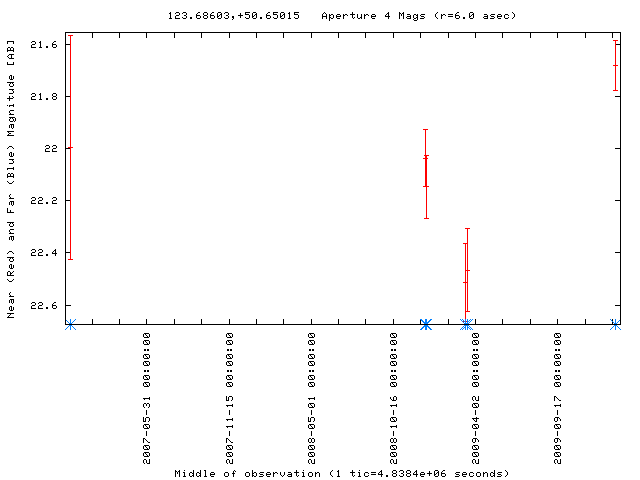
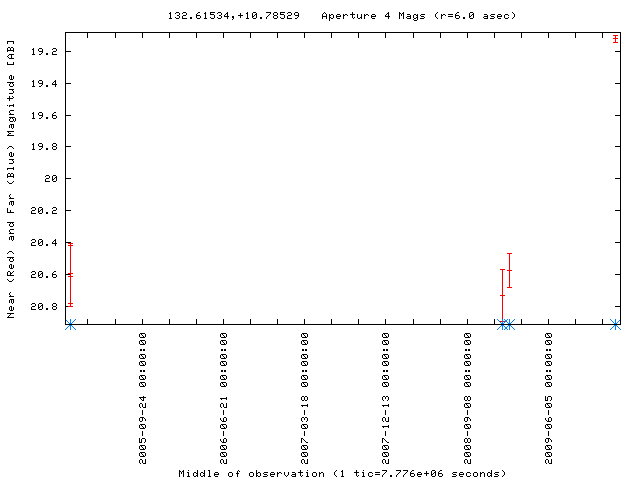
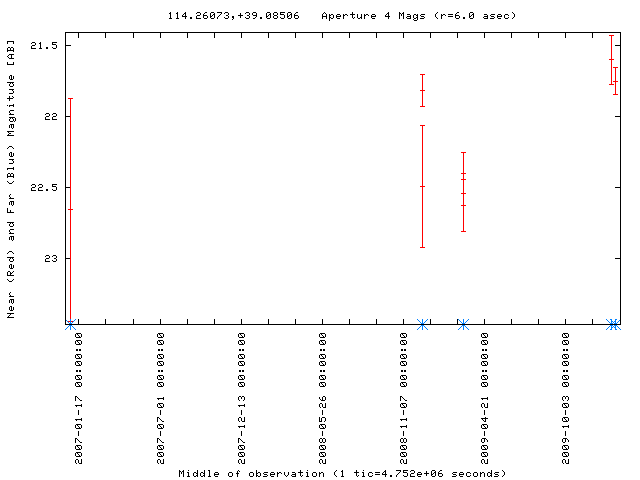
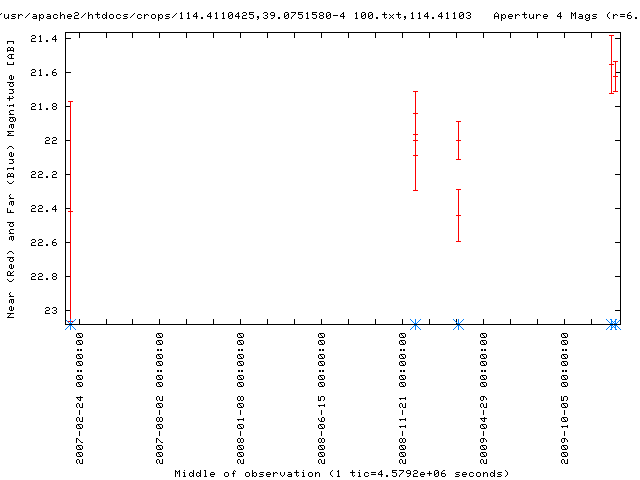
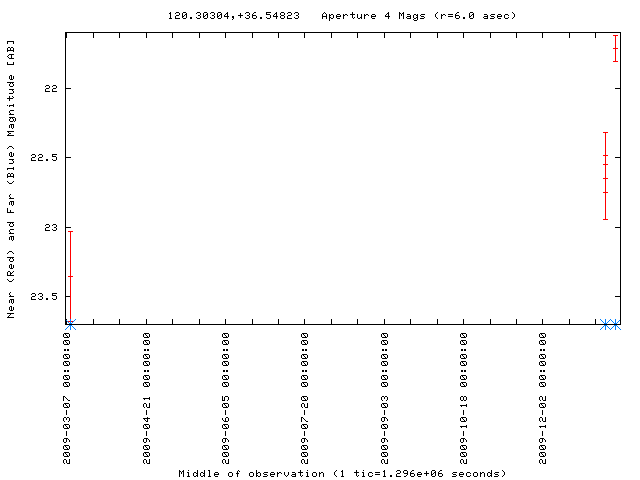
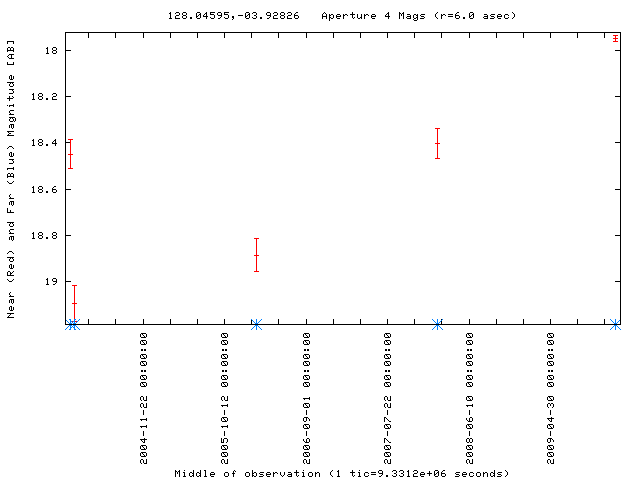
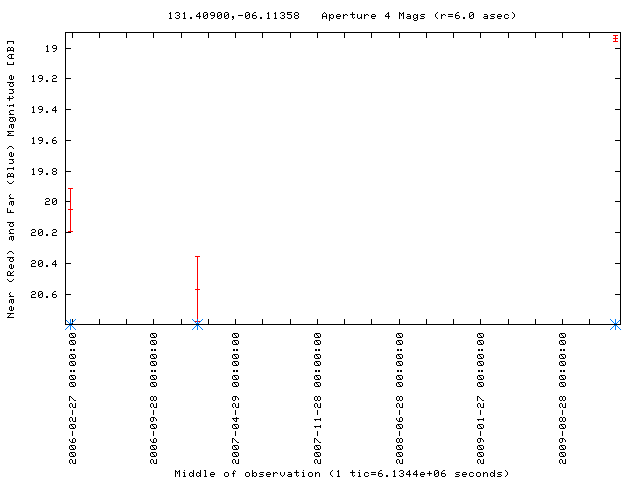
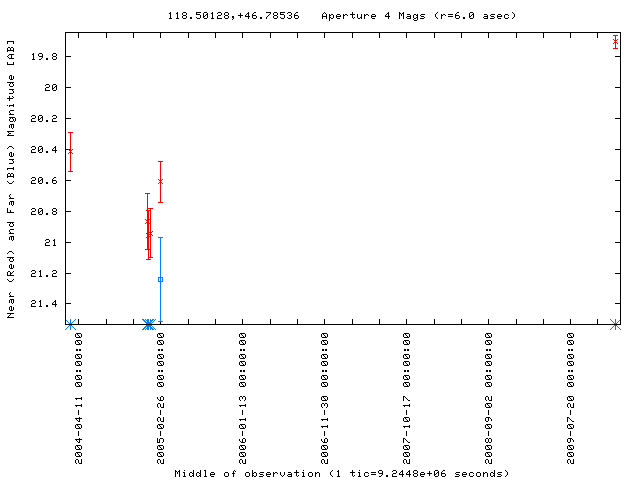
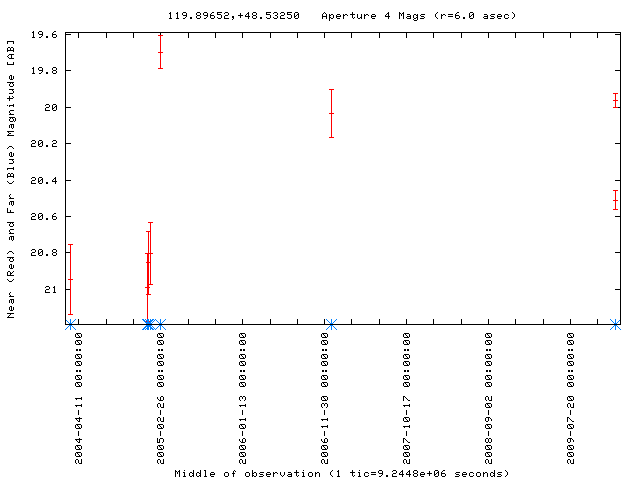
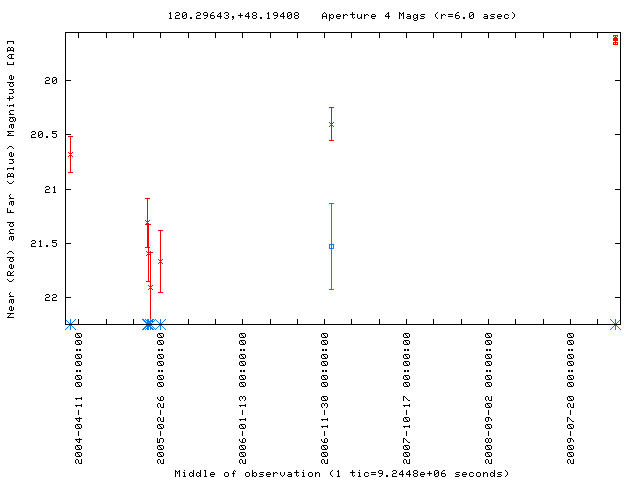
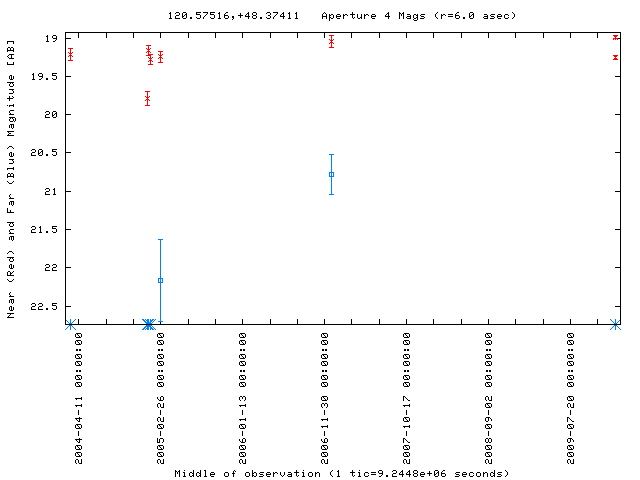
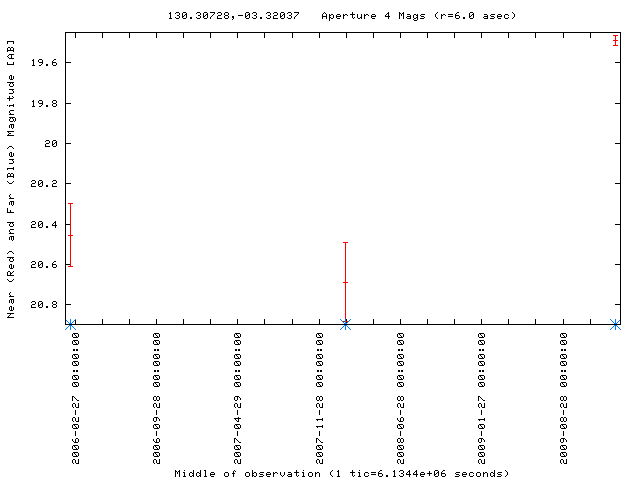
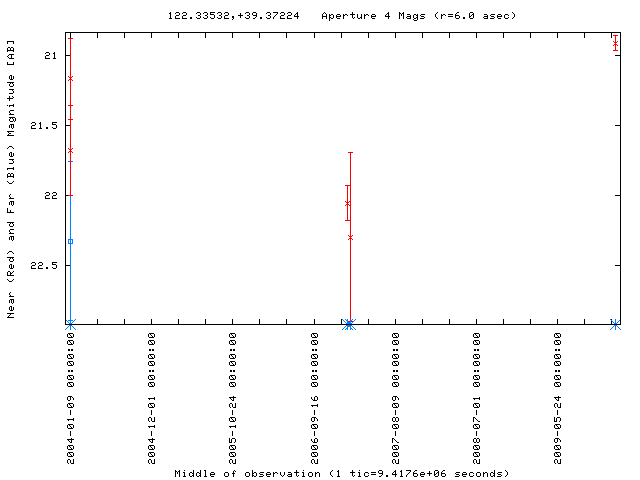
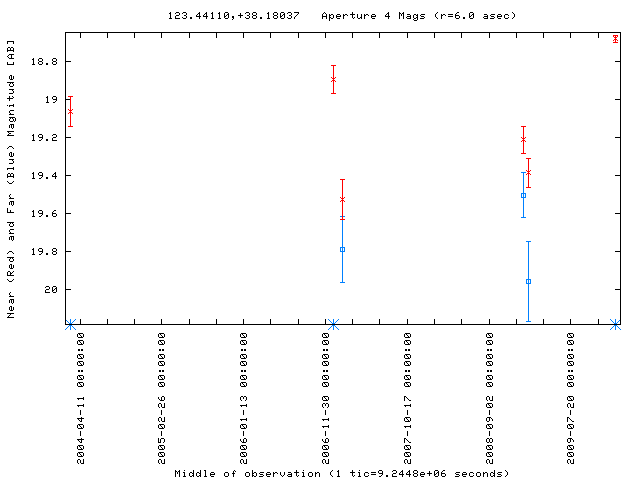
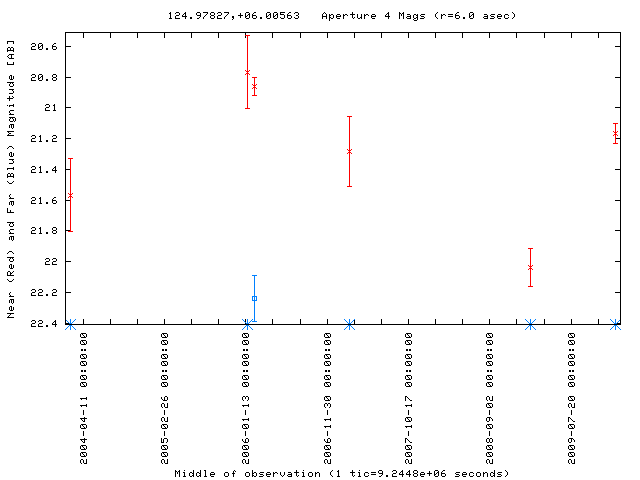
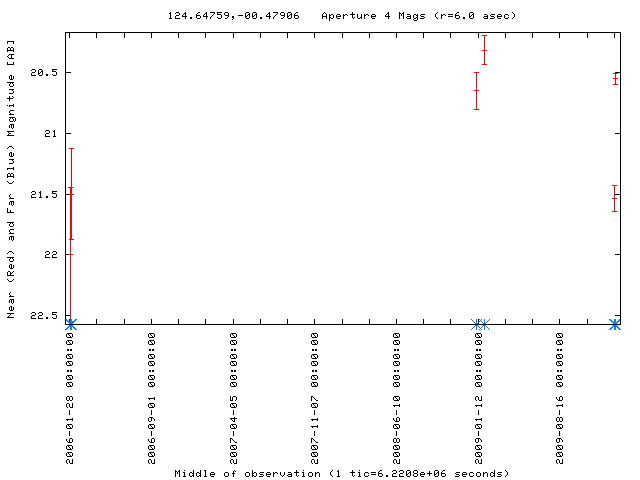
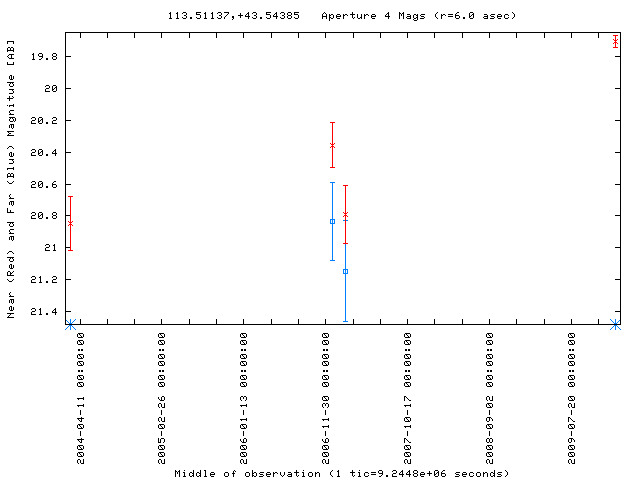
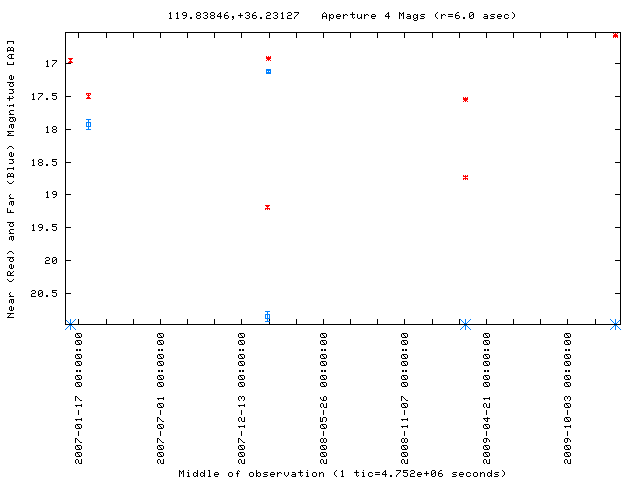
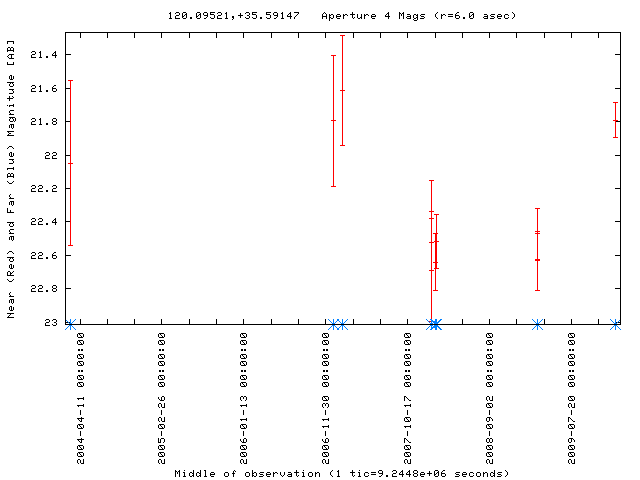
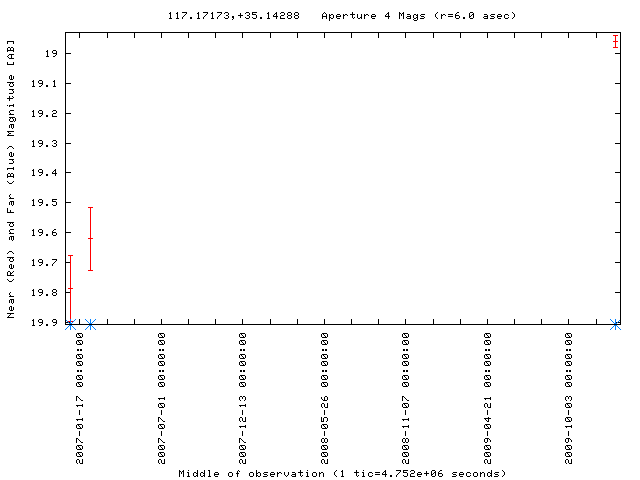
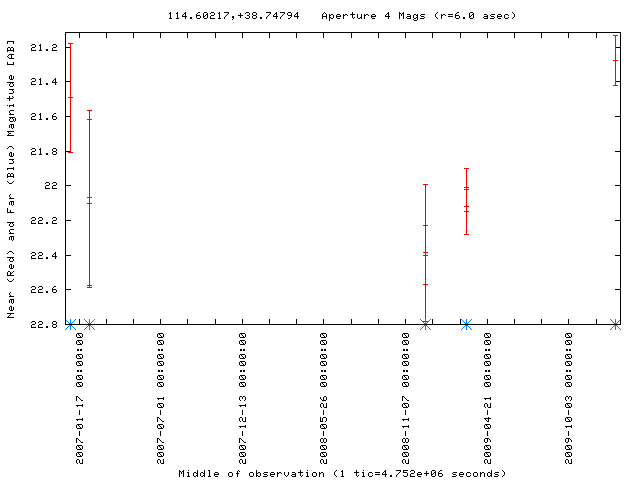
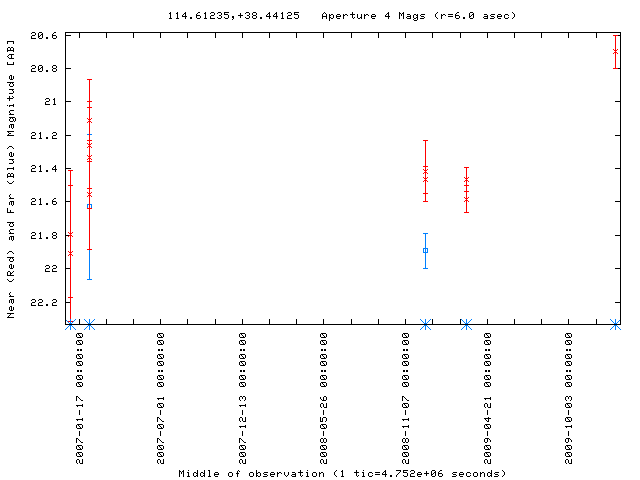
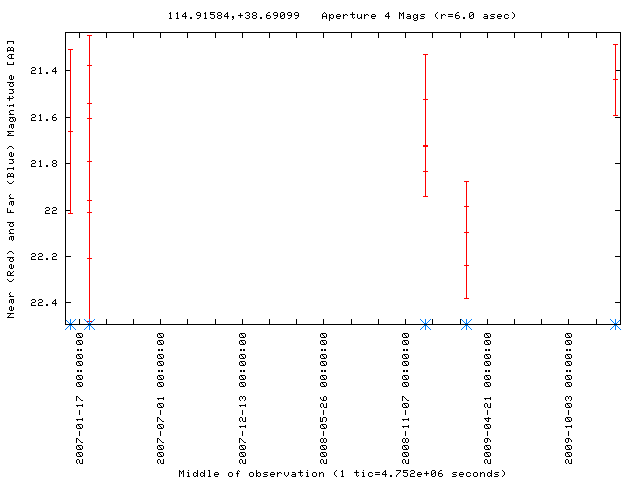
New GALEX observations are checked for variable sources every 24 hours by the GALEX science team. Alerts for validated variable sources will be posted on this page.

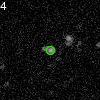
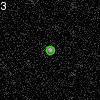
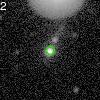
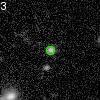
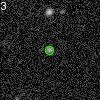
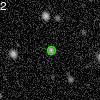
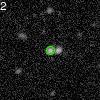
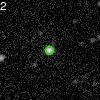
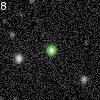
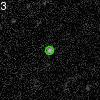
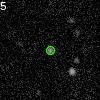
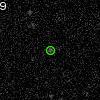
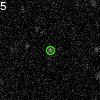
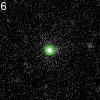
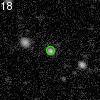
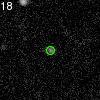
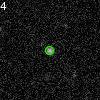
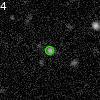
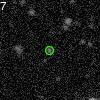
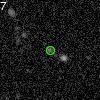
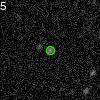
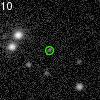
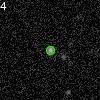
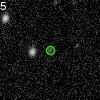
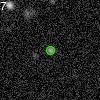
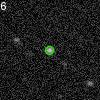
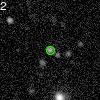
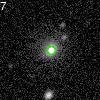
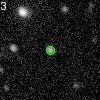
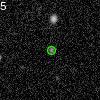
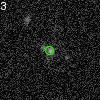
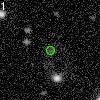
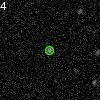
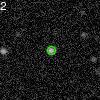
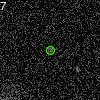
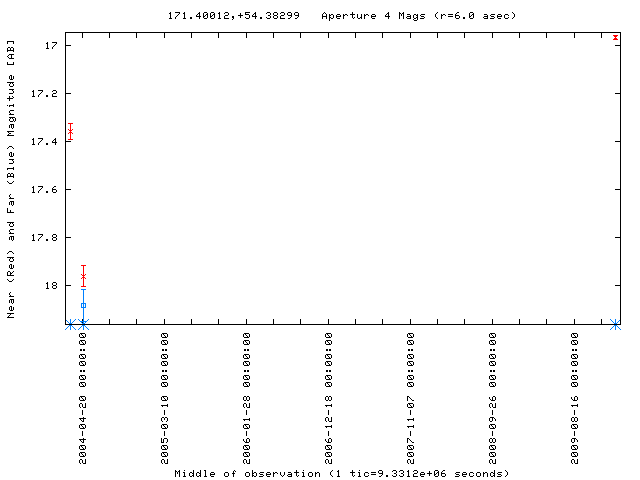
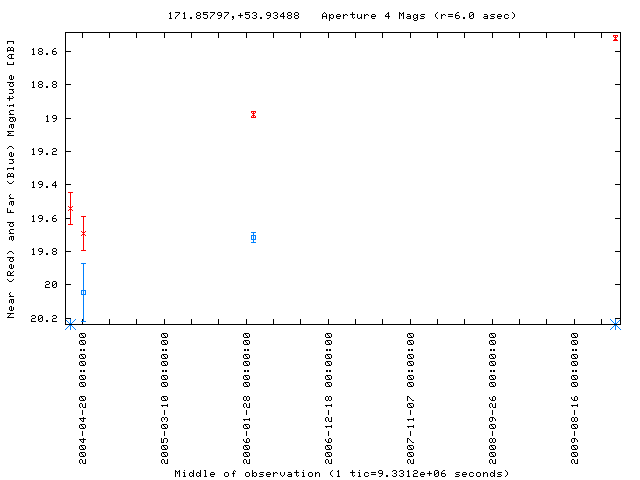
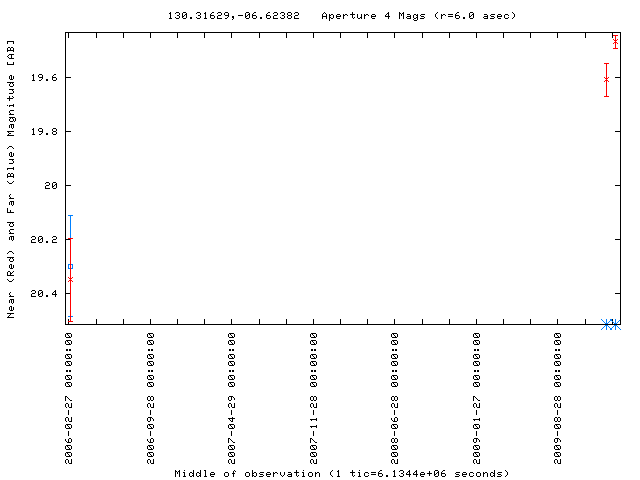
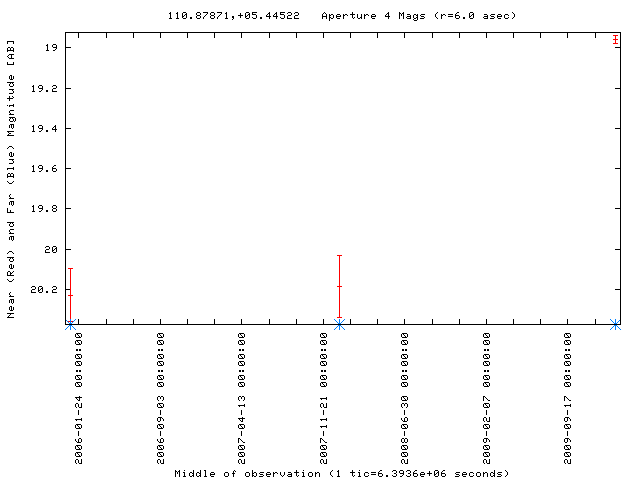
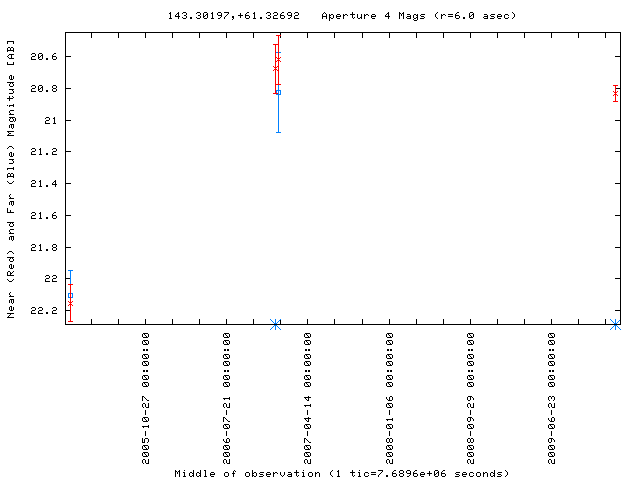
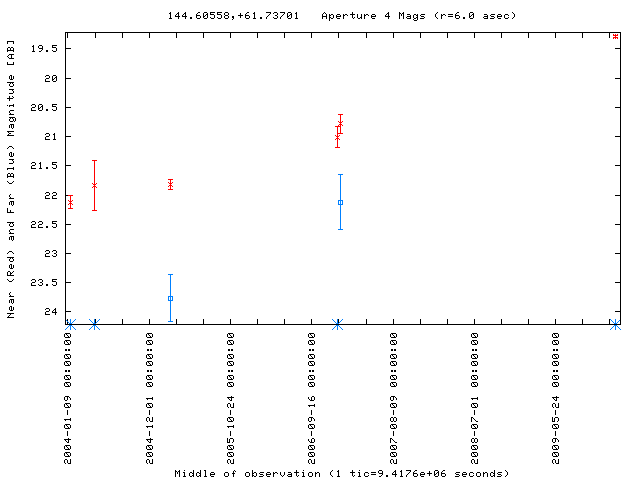
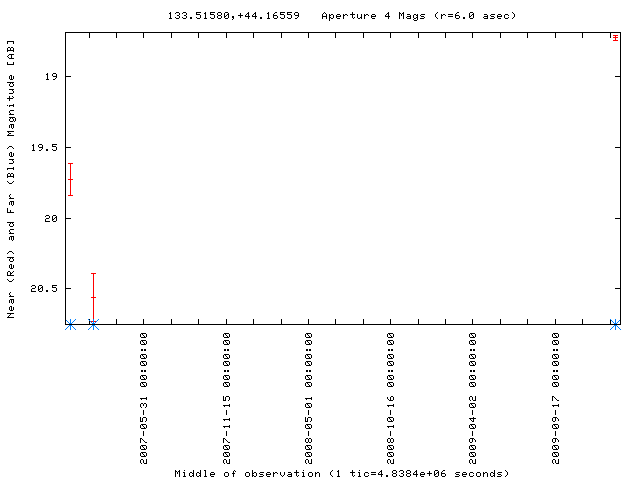
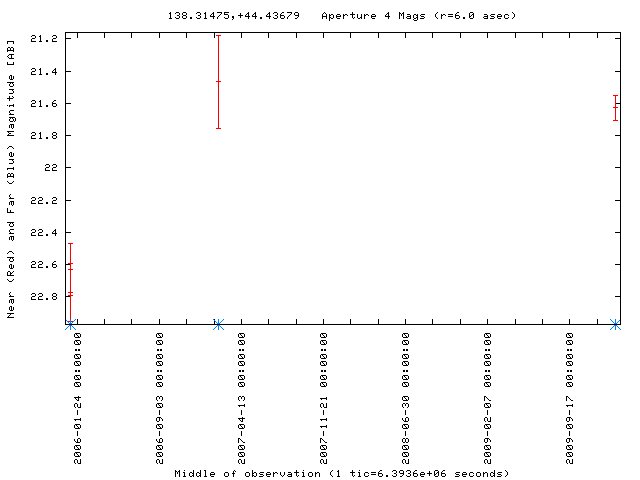
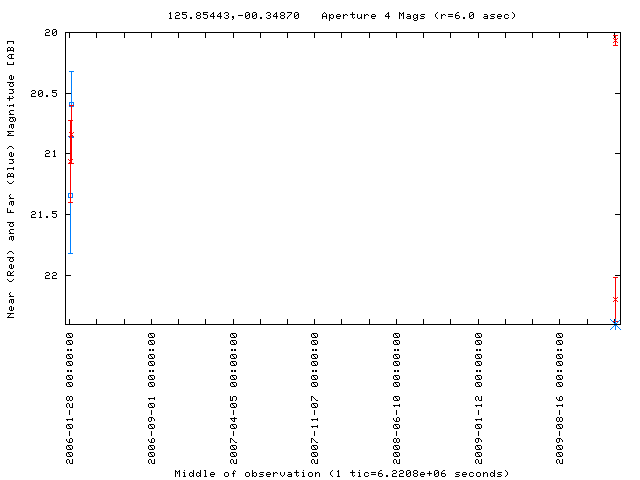
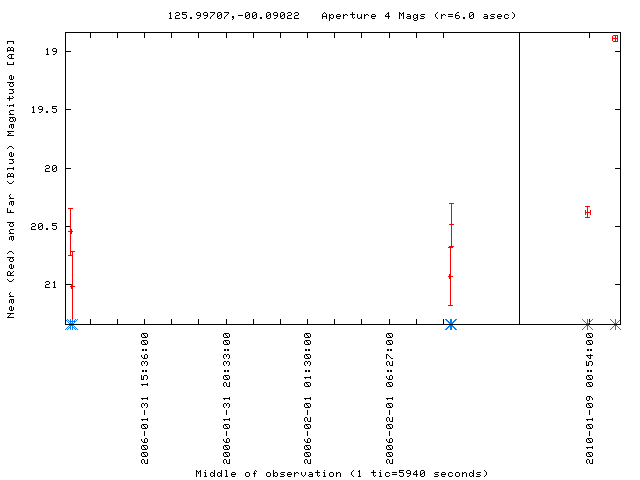
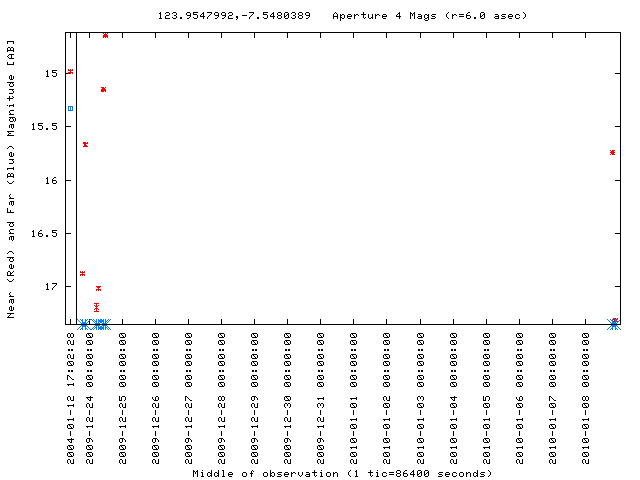
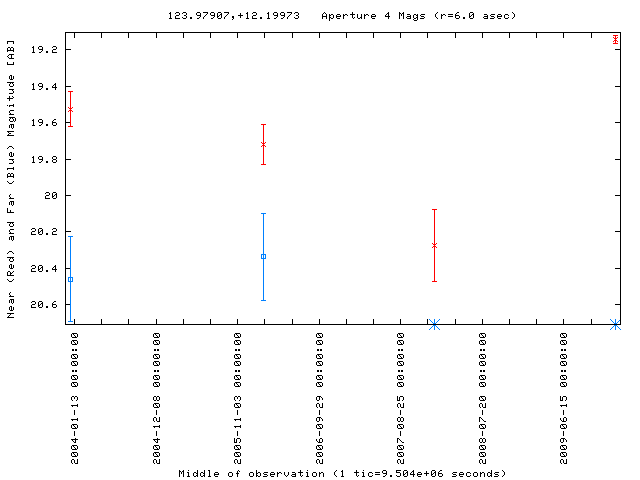
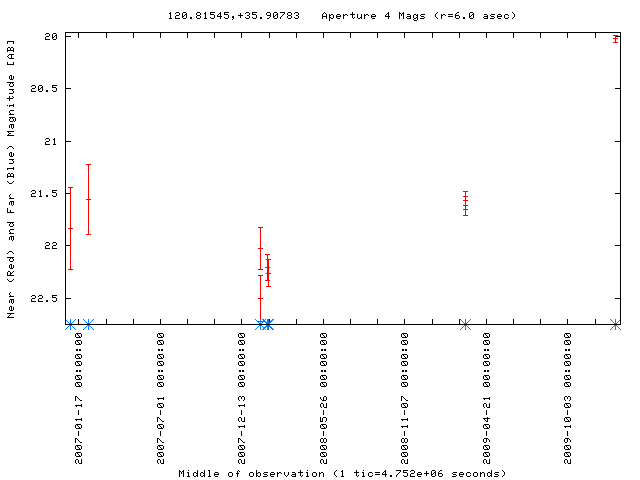
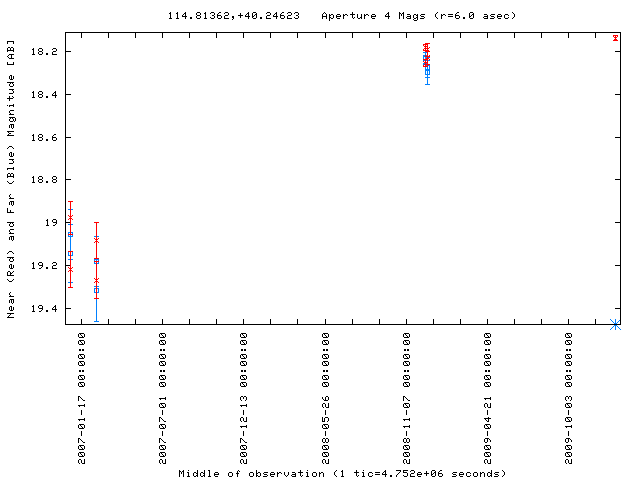
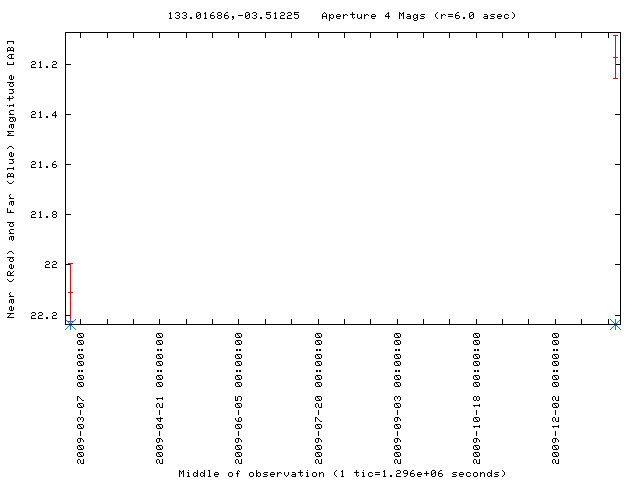
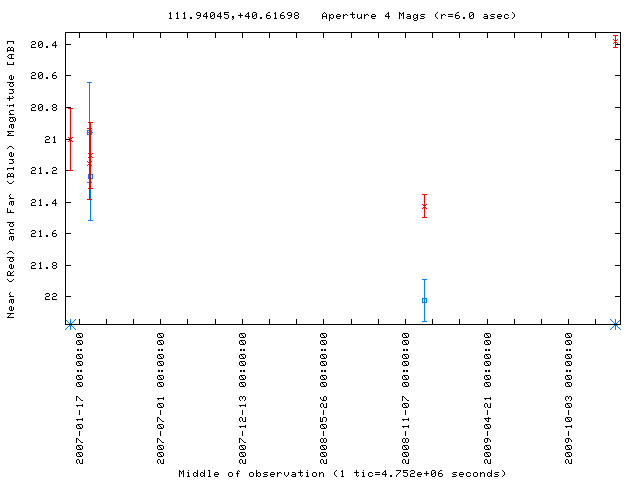
The GALEX variable alert notices from Jan., 2010 are listed below. Clicking the coordinates will perform a search of the SIMBAD database within 5 arseconds of the position. Clicking on the name of identified objects brings up the SIMBAD database entry for galactic objects and the NED database entry for extragalactic objects.

NOTES: GI data were not checked for variables.


DATE
Coordinate (J2000)
latest FUV
earlier FUV
latest NUV
earlier NUV
Identification
NUV:FUV Cutout
Light Curve
2010-01-26 167.94716 +51.09731 -80.18 -80.18 18.53 19.44 SDSS J111147.31+510549.2 LC Plot
2010-01-26 168.21087 +51.53439 -80.18 -80.18 18.62 20.31 SDSS J111250.65+513203.8 LC Plot
2010-01-25 123.41926 -01.20609 -80.18 -80.18 15.47 18.18 V390 Hya LC Plot
2010-01-25 166.73234 +54.00166 -80.18 -80.18 19.81 21.02 SDSS J110655.60+540006.7 LC Plot
2010-01-25 170.09719 +54.07414 -80.18 -80.18 19.43 20.36 SDSS J112023.23+540427.1 LC Plot
2010-01-25 171.40012 +54.38299 -80.18 -80.18 16.97 17.96 ARP 151 LC Plot
2010-01-25 171.85797 +53.93488 -80.18 20.05 18.52 19.69 SDSS J112725.89+535604.8 LC Plot
2010-01-24 130.31629 -06.62382 -80.18 20.30 19.47 20.35 - LC Plot
2010-01-23 110.87871 +05.44522 -80.18 -80.18 18.96 20.19 - LC Plot
2010-01-23 133.10695 -05.27964 -80.18 -80.18 18.89 20.14 - LC Plot
2010-01-23 133.16737 -04.79055 -80.18 -80.18 17.95 18.81 - LC Plot
2010-01-23 124.32668 -07.85745 -80.18 -80.18 17.67 18.67 - LC Plot
2010-01-23 156.49222 +44.51855 -80.18 -80.18 19.33 20.21 SDSS J102558.11+443106.2 LC Plot
2010-01-22 147.43861 +62.93418 -80.18 -80.18 20.33 21.16 SDSS J094945.09+625602.8 LC Plot
2010-01-22 148.48538 +62.74202 -80.18 -80.18 21.92 22.80 SDSS J095356.43+624431.9 LC Plot
2010-01-22 148.59621 +63.11642 -80.18 -80.18 21.31 22.26 SDSS J095423.07+630658.9 LC Plot
2010-01-22 154.67218 +46.26322 -80.18 -80.18 17.19 19.01 SDSS J101841.25+461548.0 LC Plot
2010-01-22 155.03696 +46.03140 -80.18 -80.18 18.99 20.18 SDSS J102008.82+460151.8 LC Plot
2010-01-22 155.03926 +45.40818 -80.18 -80.18 20.79 21.87 SDSS J102009.44+452427.9 LC Plot
2010-01-22 173.06442 +62.81686 -80.18 19.94 18.99 19.94 SDSS J113215.48+624900.4 LC Plot
2010-01-21 155.01619 +47.67222 -80.18 -80.18 19.20 20.04 SDSS J102003.81+474019.2 LC Plot
2010-01-21 155.87408 +48.41064 -80.18 -80.18 19.88 20.98 SDSS J102329.79+482437.1 LC Plot
2010-01-21 160.72455 +55.90334 -80.18 -80.18 20.16 22.16 - LC Plot
2010-01-21 160.99450 +55.82646 -80.18 -80.18 20.97 21.78 SDSS J104358.62+554934.8 LC Plot
2010-01-21 161.12014 +55.88256 -80.18 22.64 20.27 21.44 - LC Plot
2010-01-21 161.36837 +58.42869 -80.18 -80.18 21.91 22.72 SDSS J104528.37+582541.3 LC Plot
2010-01-21 161.71479 +58.45033 -80.18 -80.18 21.20 22.11 SDSS J104651.50+582700.1 LC Plot
2010-01-21 161.99308 +58.01270 -80.18 -80.18 21.75 22.90 SDSS J104758.26+580044.1 LC Plot
2010-01-21 162.00988 +58.48835 -80.18 -80.18 21.57 22.81 SDSS J104802.36+582917.4 LC Plot
2010-01-21 162.08373 +58.56818 -80.18 22.11 20.80 21.64 SDSS J104820.13+583404.8 LC Plot
2010-01-21 162.18429 +58.26102 -80.18 -80.18 20.08 20.92 SDSS J104844.20+581538.6 LC Plot
2010-01-21 158.82612 +54.30666 -80.18 22.83 20.06 20.95 SDSS J103518.24+541823.2 LC Plot
2010-01-21 159.85932 +57.86335 -80.18 -80.18 21.43 22.27 SDSS J103926.18+575146.1 LC Plot
2010-01-21 160.25730 +58.61493 -80.18 -80.18 21.14 22.14 SDSS J104101.74+583654.2 LC Plot
2010-01-21 160.26003 +58.64706 -80.18 -80.18 21.15 22.51 SDSS J104102.51+583850.0 LC Plot
2010-01-21 160.38026 +57.91815 -80.18 -80.18 21.25 22.59 SDSS J104131.28+575503.4 LC Plot
2010-01-21 160.44124 +58.19648 -80.18 -80.18 20.95 21.75 SDSS J104145.92+581146.6 LC Plot
2010-01-21 160.98615 +58.12572 -80.18 -80.18 17.19 18.34 IY UMa LC Plot
2010-01-20 136.61682 +62.21399 -80.18 -80.18 18.97 19.83 SDSS J090628.02+621249.3 LC Plot
2010-01-20 153.34579 +53.14110 -80.18 -80.18 20.85 21.76 SDSS J101322.93+530827.7 LC Plot
2010-01-20 154.57361 +51.62931 -80.18 19.69 18.01 19.46 SDSS J101817.60+513745.9 LC Plot
2010-01-20 162.16074 +60.65960 -80.18 23.35 20.11 21.08 SDSS J104838.65+603933.1 LC Plot
2010-01-20 162.47747 +60.67285 -80.18 22.81 20.78 21.82 SDSS J104954.60+604021.2 LC Plot
2010-01-19 152.54394 +68.03069 -80.18 -80.18 19.47 20.42 - LC Plot
2010-01-18 132.70973 +40.83136 -80.18 -80.18 18.74 20.20 SDSS J085050.35+404952.0 LC Plot
2010-01-17 143.30197 +61.32692 -80.18 22.11 20.83 22.15 SDSS J093312.47+611936.3 LC Plot
2010-01-17 144.60558 +61.73701 -80.18 -80.18 19.29 21.01 SDSS J093825.40+614414.6 LC Plot
2010-01-17 133.51580 +44.16559 -80.18 -80.18 18.73 19.73 SDSS J085403.88+440956.0 LC Plot
2010-01-17 138.31475 +44.43679 -80.18 -80.18 21.63 22.77 - LC Plot
2010-01-17 138.98628 +44.71677 -80.18 -80.18 18.86 19.67 SDSS J091556.72+444259.7 LC Plot
2010-01-16 139.69100 +62.98028 -80.18 -80.18 19.77 20.65 SDSS J091845.81+625848.5 LC Plot
2010-01-16 133.91527 +60.49366 -80.18 -80.18 16.35 17.97 SDSS J085539.55+602936.4 LC Plot
2010-01-16 135.89021 +61.54990 -80.18 -80.18 19.80 20.73 SDSS J090333.62+613300.4 LC Plot
2010-01-15 121.12873 +31.90203 -80.18 21.05 19.82 20.67 SDSS J080430.87+315404.9 LC Plot
2010-01-15 125.71244 +42.49655 -80.18 -80.18 19.94 20.80 SDSS J082250.98+422946.9 LC Plot
2010-01-14 130.44241 +50.60040 -80.18 -80.18 19.28 20.31 SDSS J084146.19+503600.9 LC Plot
2010-01-14 131.08033 +50.53151 -80.18 -80.18 19.38 20.80 2MASSi J0844193+503152 LC Plot
2010-01-14 129.28930 +44.81797 -80.18 -80.18 21.33 22.47 SDSS J083709.39+444905.5 LC Plot
2010-01-14 129.38930 +44.44383 -80.18 -80.18 21.31 22.66 SDSS J083733.44+442637.9 LC Plot
2010-01-14 129.48152 +44.29590 -80.18 -80.18 21.98 22.86 SDSS J083755.59+441745.3 LC Plot
2010-01-14 130.03762 +44.54069 -80.18 -80.18 21.93 22.81 SDSS J084008.96+443225.6 LC Plot
2010-01-14 130.20057 +44.29106 -80.18 -80.18 21.42 22.69 SDSS J084048.19+441726.5 LC Plot
2010-01-14 126.28468 +42.42156 -80.18 18.66 17.72 18.92 2MASX J08250823+4225163 LC Plot
2010-01-14 127.27483 +42.03461 -80.18 21.53 19.23 20.42 SDSS J082905.98+420204.2 LC Plot
2010-01-13 126.49331 +48.53638 -80.18 -80.18 21.19 22.00 SDSS J082558.38+483209.4 LC Plot
2010-01-13 126.52075 +54.15237 -80.18 -80.18 19.89 20.75 SDSS J082605.04+540908.6 LC Plot
2010-01-13 126.77073 +48.55848 -80.18 -80.18 21.14 22.21 SDSS J082704.92+483329.7 LC Plot
2010-01-13 127.28507 +48.44419 -80.18 -80.18 20.67 21.58 SDSS J082908.41+482638.8 LC Plot
2010-01-13 133.25643 +11.57861 -80.18 -80.18 21.60 22.42 SDSS J085301.51+113443.0 LC Plot
2010-01-12 119.58770 +37.92594 -80.18 -80.18 19.37 20.30 SDSS J075821.01+375533.2 LC Plot
2010-01-12 123.68603 +50.65015 -80.18 -80.18 21.68 22.51 SDSS J081444.75+503901.1 LC Plot
2010-01-12 132.61534 +10.78529 -80.18 -80.18 19.12 20.61 AF Cnc LC Plot
2010-01-11 114.26073 +39.08506 -80.18 -80.18 21.75 22.63 SDSS J073702.56+390506.4 LC Plot
2010-01-11 114.41103 +39.07533 -80.18 -80.18 21.63 22.44 SDSS J073738.68+390430.7 LC Plot
2010-01-11 120.30304 +36.54823 -80.18 -80.18 21.71 22.75 SDSS J080112.77+363253.3 LC Plot
2010-01-11 128.04595 -03.92826 -80.18 -80.18 17.95 18.89 - LC Plot
2010-01-11 131.40900 -06.11358 -80.18 -80.18 18.94 20.05 - LC Plot
2010-01-09 118.50128 +46.78536 -80.18 -80.18 19.71 20.87 SDSS J075400.37+464707.0 LC Plot
2010-01-11 119.89652 +48.53250 -80.18 -80.18 19.97 20.85 SDSS J075935.19+483156.4 LC Plot
2010-01-11 120.29643 +48.19408 -80.18 -80.18 19.62 20.68 SDSS J080111.21+481137.8 LC Plot
2010-01-11 120.57516 +48.37411 -80.18 -80.18 18.99 19.79 SDSS J080218.04+482225.5 LC Plot
2010-01-11 130.30728 -03.32037 -80.18 -80.18 19.49 20.69 - LC Plot
2010-01-09 122.33532 +39.37224 -80.18 -80.18 20.91 22.06 SDSS J080920.43+392219.2 LC Plot
2010-01-09 123.44110 +38.18037 -80.18 19.79 18.68 19.53 KUG 0810+383 LC Plot
2010-01-09 124.97827 +06.00563 -80.18 -80.18 21.17 22.04 - LC Plot
2010-01-09 125.85443 -00.34870 -80.18 -80.18 20.07 22.20 SDSS J082325.07-002055.4 LC Plot
2010-01-09 125.99707 -00.09022 -80.18 -80.18 18.89 20.38 SDSS J082359.34-000525.4 LC Plot
2010-01-08 123.95480 -07.54804 -80.18 -80.18 15.74 17.01 - LC Plot
2010-01-08 123.97907 +12.19973 -80.18 -80.18 19.14 20.27 SDSS J081555.04+121158.6 LC Plot
2010-01-08 124.64759 -00.47906 -80.18 -80.18 20.55 21.54 SDSS J081835.38-002845.1 LC Plot
2010-01-07 113.51137 +43.54385 -80.18 -80.18 19.70 20.85 SDSS J073402.62+433237.0 LC Plot
2010-01-06 119.83846 +36.23127 -80.18 17.93 16.57 17.49 SDSS J075921.15+361352.9 LC Plot
2010-01-06 120.09521 +35.59147 -80.18 -80.18 21.79 22.63 SDSS J080022.68+353528.0 LC Plot
2010-01-06 120.81545 +35.90783 -80.18 -80.18 20.02 22.26 SDSS J080315.92+355427.7 LC Plot
2010-01-05 114.81362 +40.24623 -80.18 19.06 18.14 18.98 SDSS J073915.35+401445.7 LC Plot
2010-01-05 133.01686 -03.51225 -80.18 -80.18 21.17 22.11 - LC Plot
2010-01-04 111.94045 +40.61698 -80.18 22.02 20.38 21.42 SDSS J072745.75+403701.6 LC Plot
2010-01-04 117.17173 +35.14288 -80.18 -80.18 18.96 19.78 SDSS J074841.25+350834.0 LC Plot
2010-01-04 114.60217 +38.74794 -80.18 -80.18 21.28 22.40 SDSS J073824.52+384452.2 LC Plot
2010-01-04 114.61235 +38.44125 -80.18 -80.18 20.70 21.58 SDSS J073827.04+382627.6 LC Plot
2010-01-04 114.91584 +38.69099 -80.18 -80.18 21.44 22.24 SDSS J073939.82+384126.7 LC Plot
2010-01-04 112.84869 +37.52126 -80.18 -80.18 19.01 20.07 SDSS J073123.72+373115.7 LC Plot

Archive Navigation: Monthly Archive | Current