

GALEX TDS Alerts Archive: Nov 2008
Archive Navigation: Monthly Archive | Current
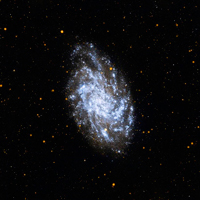
New GALEX observations are checked for variable sources every 24 hours by the GALEX science team. Alerts for validated variable sources will be posted on this page.
The GALEX variable alert notices from Nov., 2008 are listed below. Clicking the coordinates will perform a search of the SIMBAD database within 5 arseconds of the position. Clicking on the name of identified objects brings up the SIMBAD database entry for galactic objects and the NED database entry for extragalactic objects.
NOTES: GI data were not checked for variables.
DATE |
Coordinate (J2000) |
latest FUV |
earlier FUV |
latest NUV |
earlier NUV |
Identification |
NUV:FUV Cutout |
Light Curve |
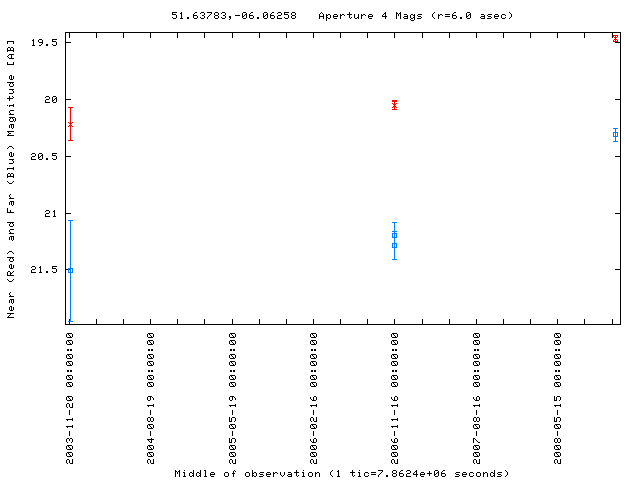
| 2008-11-23 | 51.63783 -06.06258 | 20.31 | 21.28 | 19.46 | 20.05 | SDSS J032633.13-060345.4 | 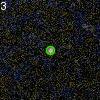 |
LC Plot |
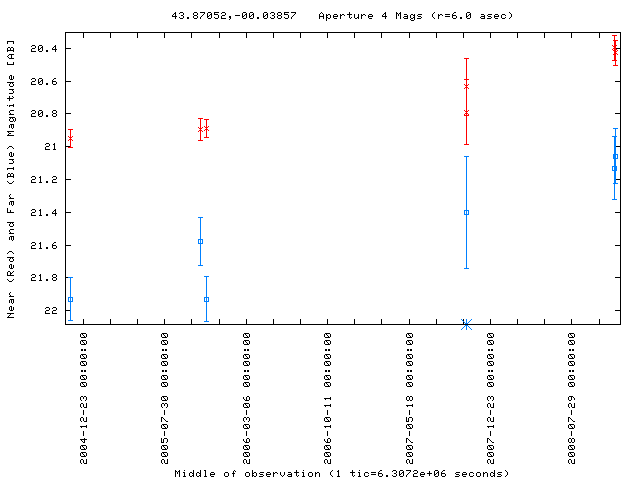
| 2008-11-22 | 43.87052 -00.03857 | 21.06 | 21.93 | 20.43 | 20.95 | SDSS J025528.92-000219.2 | 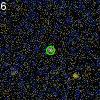 |
LC Plot |
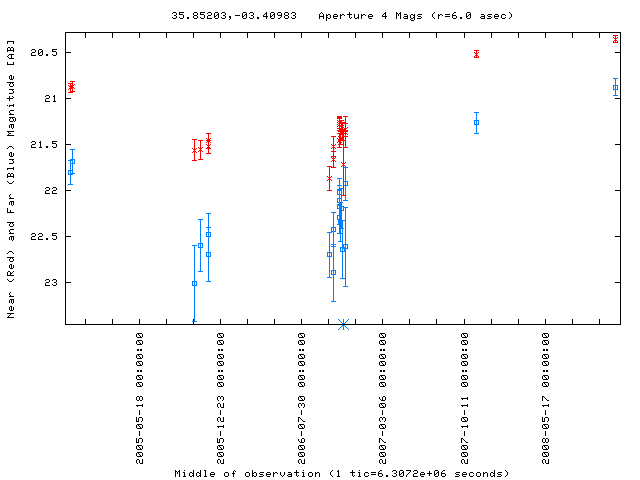
| 2008-11-21 | 35.85203 -03.40983 | 20.88 | 22.11 | 20.35 | 21.26 | - | 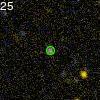 |
LC Plot |
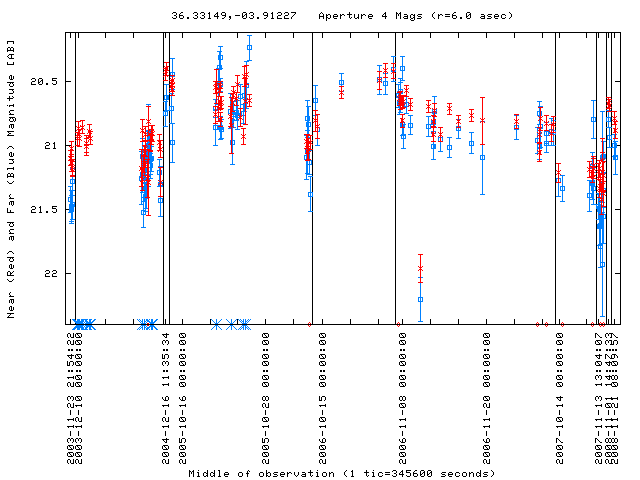
| 2008-11-21 | 36.33149 -03.91227 | 21.00 | 22.20 | 20.79 | 21.96 | APMUKS(BJ) B022248.48-040814.5 | 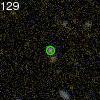 |
LC Plot |
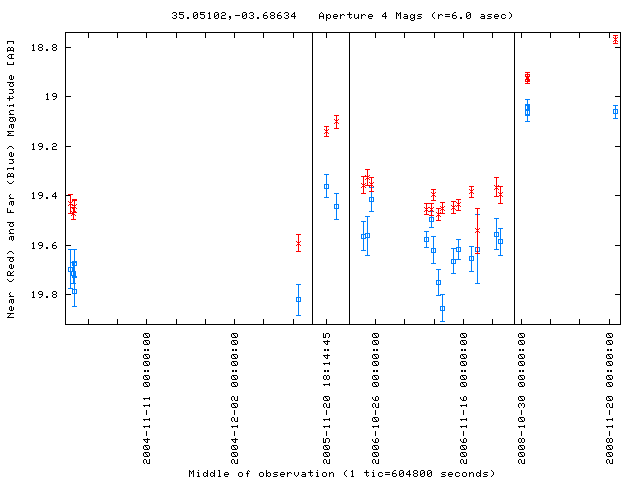
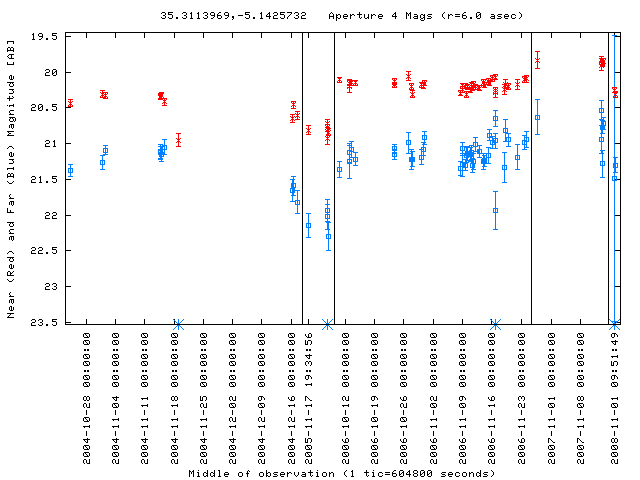
| 2008-11-21 | 35.05102 -03.68634 | 19.06 | 19.82 | 18.77 | 19.59 | SWIRE J022012.21-034111.8 | 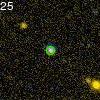 |
LC Plot |
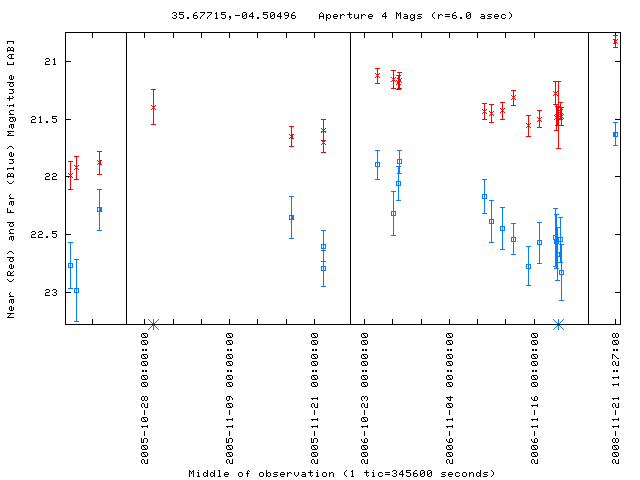
| 2008-11-21 | 35.67715 -04.50496 | 21.63 | 22.35 | 20.83 | 21.65 | - | 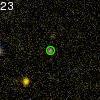 |
LC Plot |
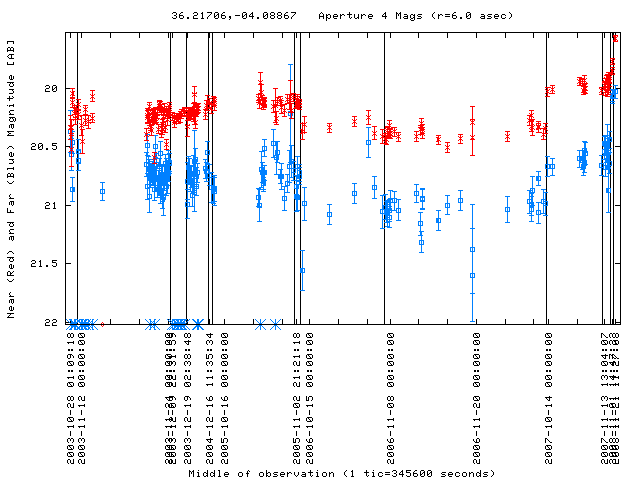
| 2008-11-21 | 36.21706 -04.08867 | 20.03 | 20.87 | 19.57 | 19.94 | XMDS J022452.1-040518 | 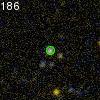 |
LC Plot |
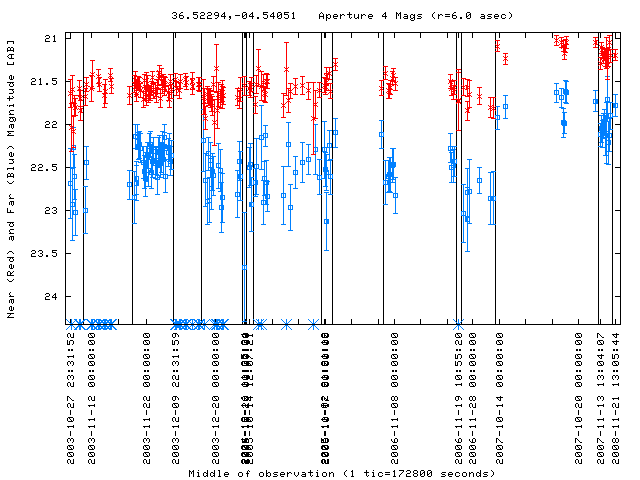
| 2008-11-21 | 36.52294 -04.54051 | 21.78 | 22.61 | 21.20 | 21.56 | XMDS J022605.4-043226 |  |
LC Plot |
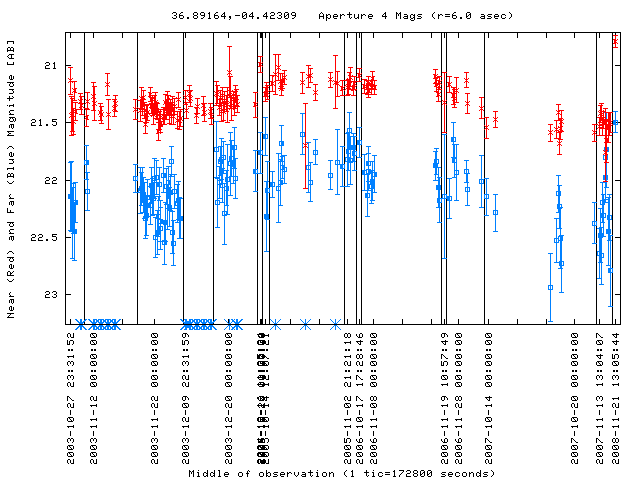
| 2008-11-21 | 36.89164 -04.42309 | 21.49 | 22.36 | 20.78 | 21.50 | - |  |
LC Plot |
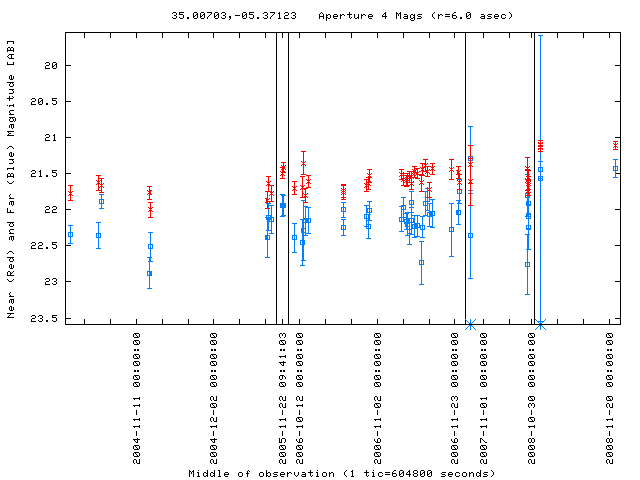
| 2008-11-21 | 35.00703 -05.37123 | 21.43 | 22.51 | 21.11 | 22.00 | - |  |
LC Plot |
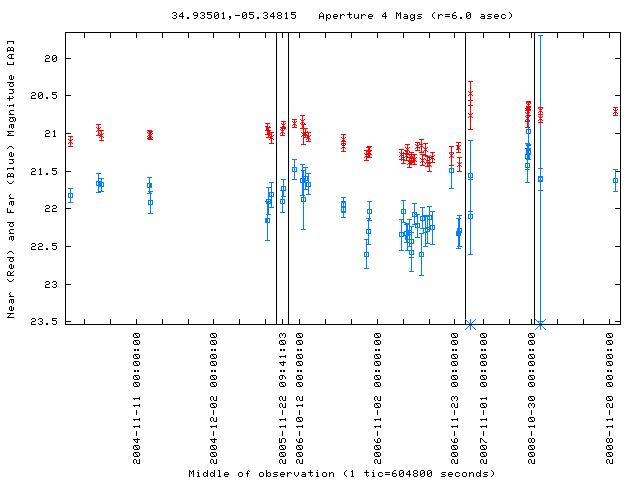
| 2008-11-21 | 34.93501 -05.34815 | 21.62 | 22.60 | 20.71 | 21.29 | - |  |
LC Plot |
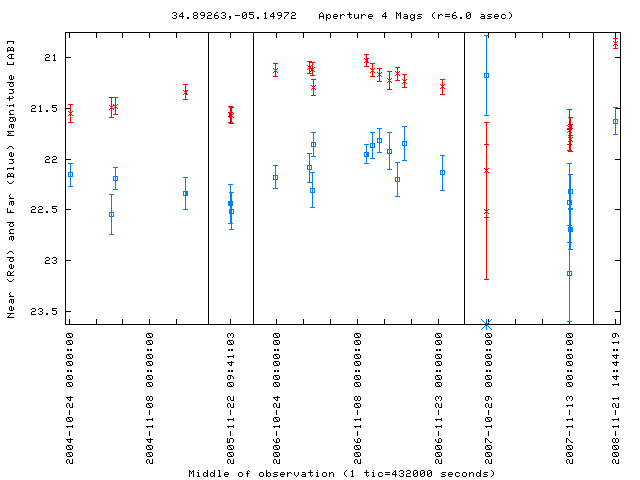
| 2008-11-21 | 34.89263 -05.14972 | 21.63 | 22.55 | 20.86 | 21.49 | - | 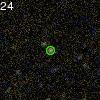 |
LC Plot |
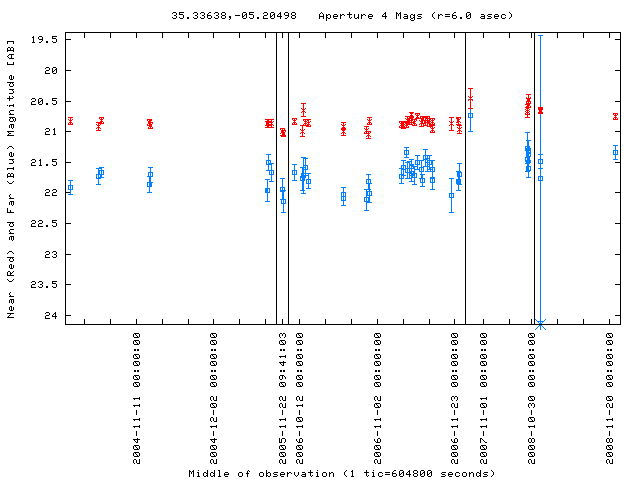
| 2008-11-21 | 35.33638 -05.20498 | 21.34 | 22.14 | 20.75 | 21.03 | - | 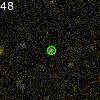 |
LC Plot |
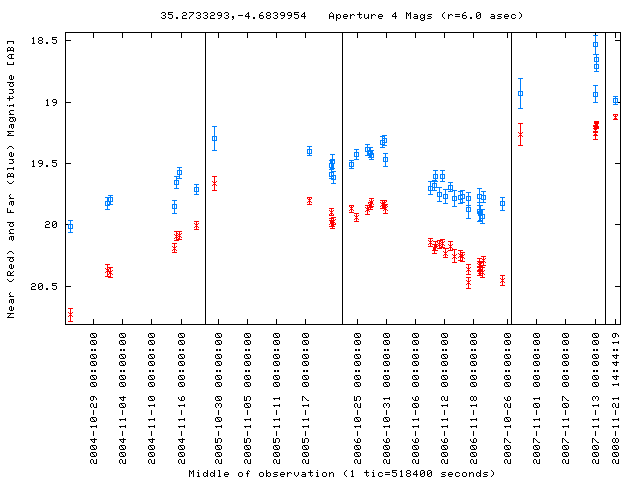
| 2008-11-21 | 35.27333 -04.68400 | 18.99 | 19.71 | 19.12 | 20.01 | 2MASX J02210563-0441014 | 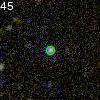 |
LC Plot |
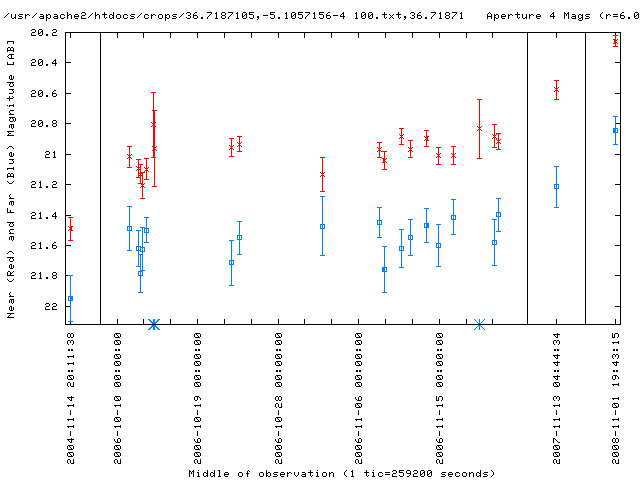
| 2008-11-21 | 36.71871 -05.10572 | 20.87 | 21.95 | 20.34 | 21.49 | - | 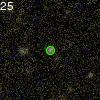 |
LC Plot |
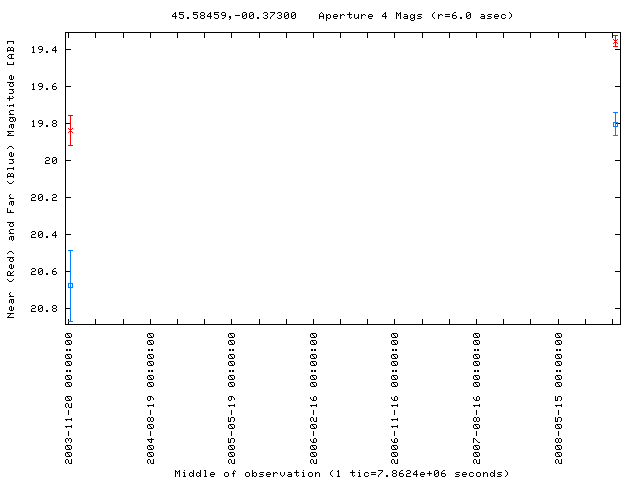
| 2008-11-21 | 45.58459 -00.37300 | 19.81 | 20.68 | 19.36 | 19.84 | LBQS 0259-0034 | 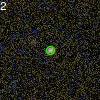 |
LC Plot |
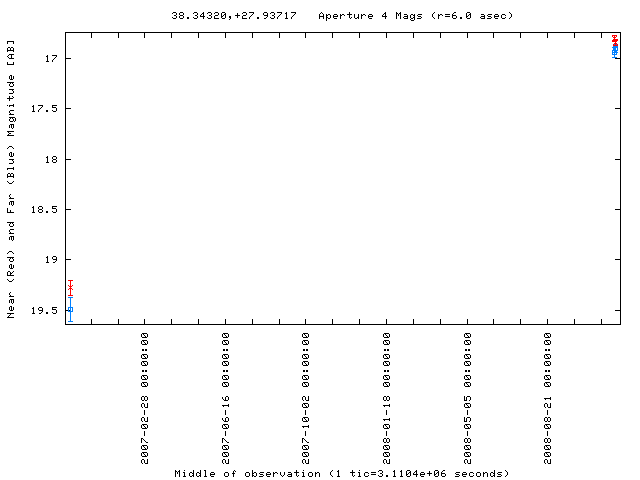
| 2008-11-19 | 38.34320 +27.93717 | 16.90 | 19.49 | 16.84 | 19.28 | MRK 1179 | 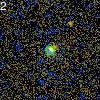 |
LC Plot |
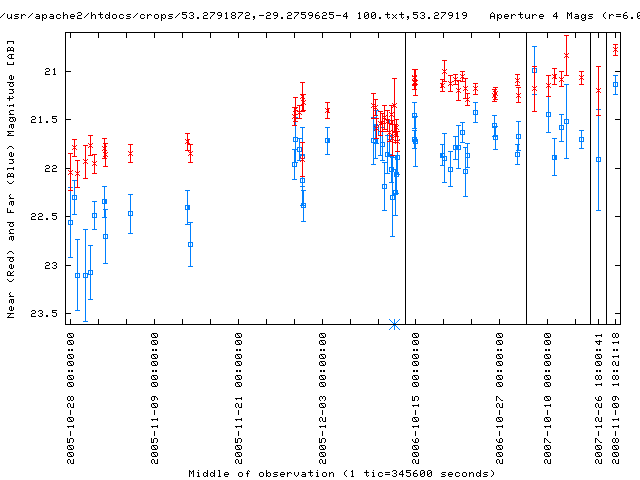
| 2008-11-18 | 53.27919 -29.27596 | 20.90 | 21.71 | 20.76 | 21.41 | - | 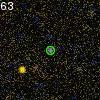 |
LC Plot |
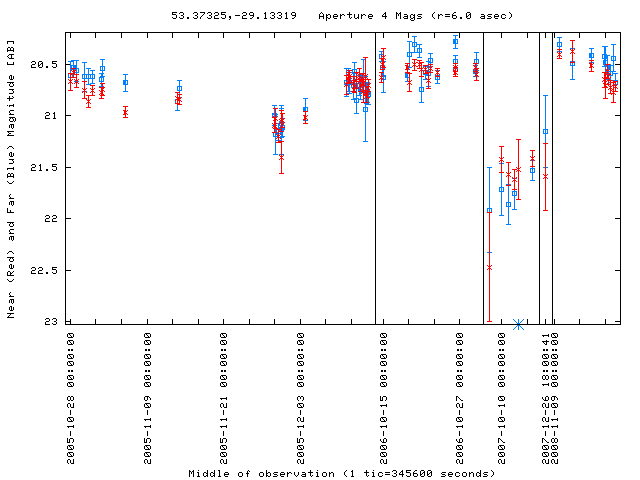
| 2008-11-18 | 53.37325 -29.13319 | 20.68 | 21.53 | 20.72 | 21.42 | APMUKS(BJ) B033125.79-291803.5 | 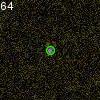 |
LC Plot |
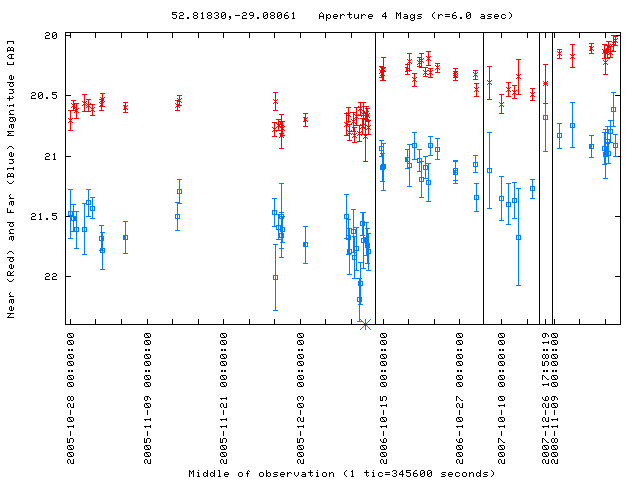
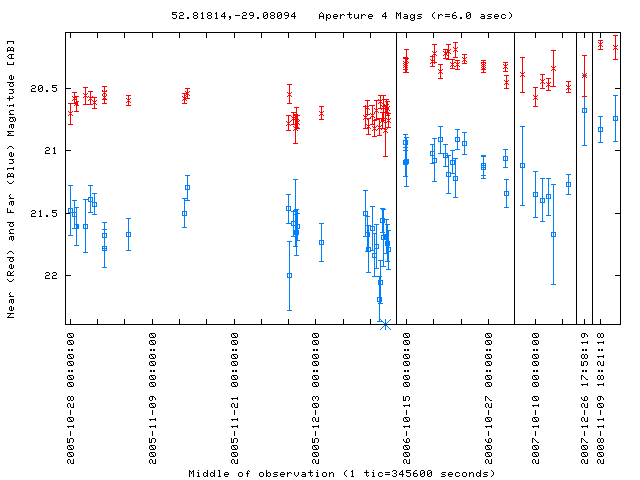
| 2008-11-18 | 52.81830 -29.08061 | 20.91 | 21.74 | 20.05 | 20.66 | - |  |
LC Plot |
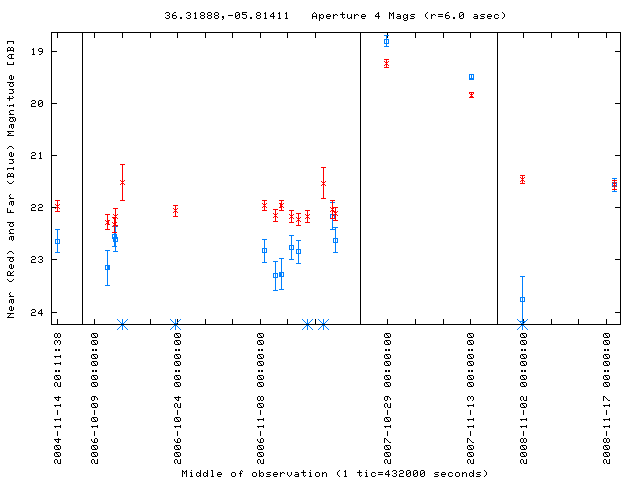
| 2008-11-18 | 36.31888 -05.81411 | 21.56 | 22.56 | 21.56 | 22.33 | APMUKS(BJ) B022246.86-060222.2 |  |
LC Plot |
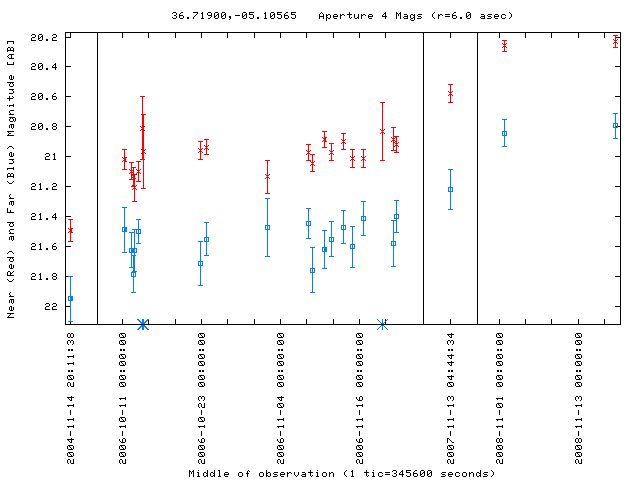
| 2008-11-18 | 36.71900 -05.10565 | 20.79 | 21.76 | 20.23 | 21.04 | - |  |
LC Plot |
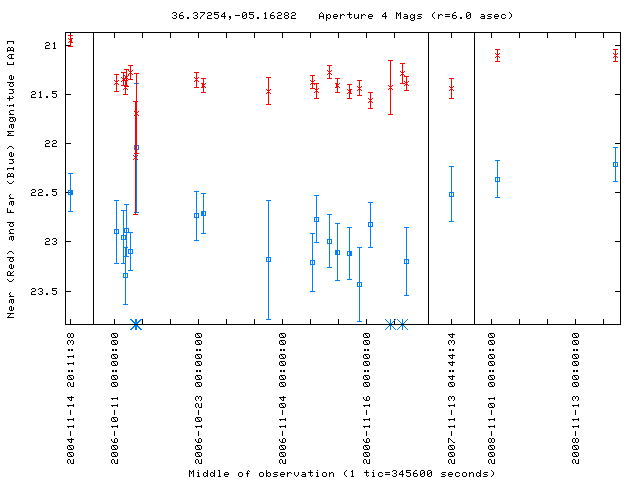
| 2008-11-18 | 36.37254 -05.16282 | 22.21 | 23.09 | 21.10 | 21.27 | - |  |
LC Plot |
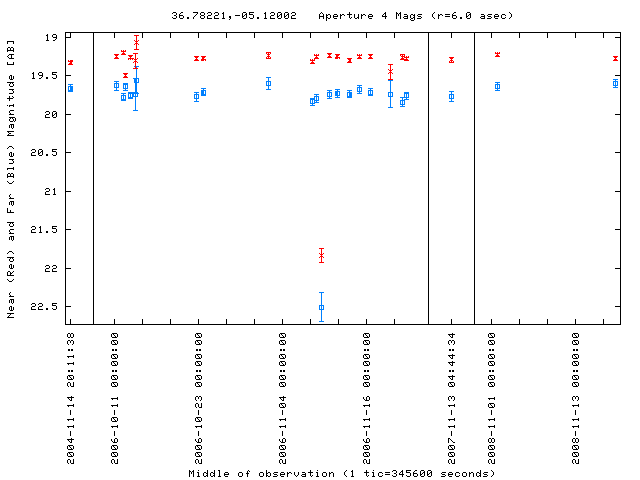
| 2008-11-18 | 36.78221 -05.12002 | 19.60 | 22.50 | 19.28 | 21.84 | APMUKS(BJ) B022437.54-052037.6 | 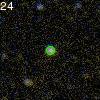 |
LC Plot |
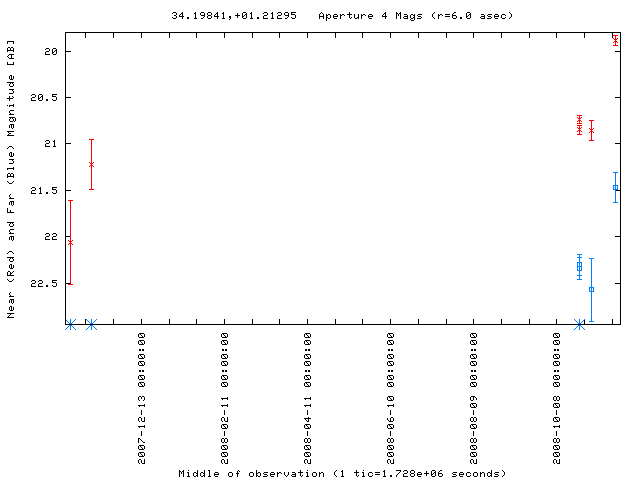
| 2008-11-18 | 34.19841 +01.21295 | 21.47 | 22.35 | 19.88 | 20.85 | - | 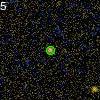 |
LC Plot |
| 2008-11-15 | 10.10773 -42.21870 | 21.50 | 22.45 | 20.82 | 21.91 | - | 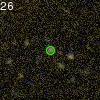 |
LC Plot |
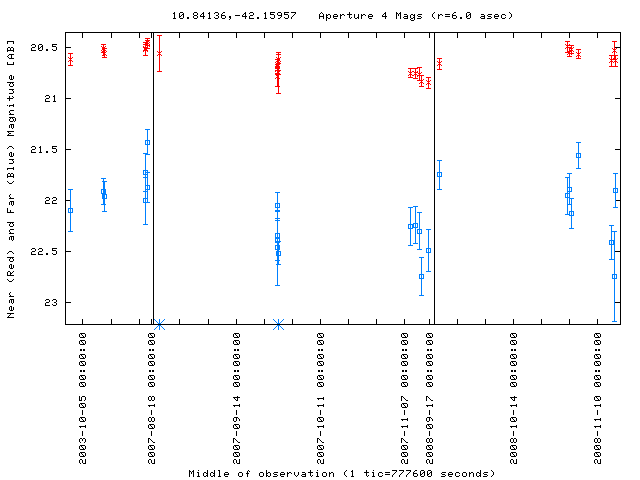
| 2008-11-15 | 10.84136 -42.15957 | 21.90 | 22.75 | 20.63 | 20.83 | - | 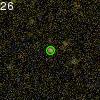 |
LC Plot |
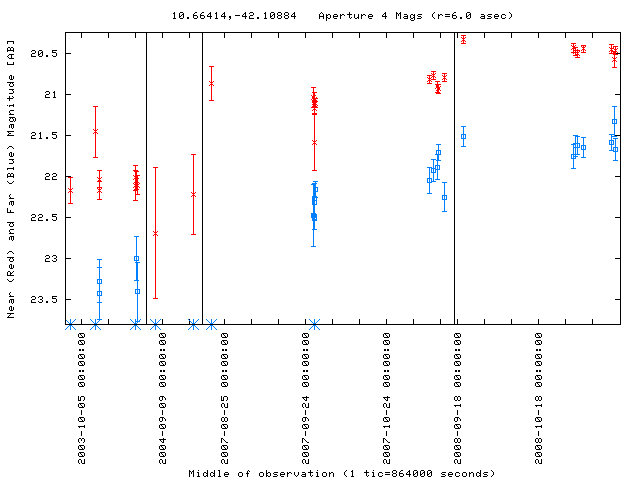
| 2008-11-15 | 10.66414 -42.10884 | 21.68 | 22.50 | 20.47 | 21.11 | - | 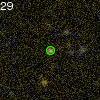 |
LC Plot |
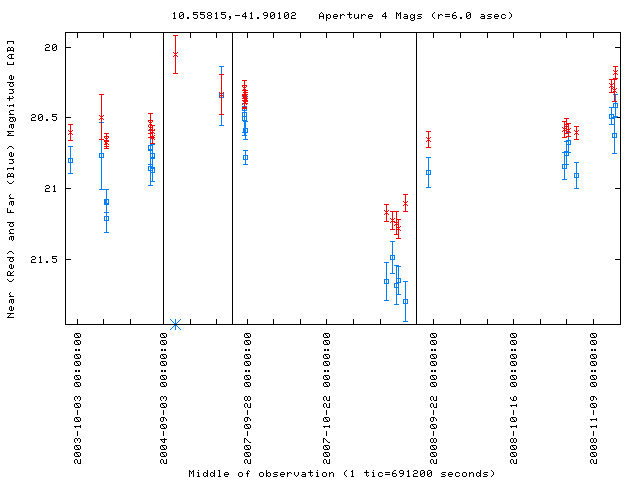
| 2008-11-15 | 10.55815 -41.90102 | 20.41 | 21.66 | 20.18 | 21.17 | - | 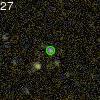 |
LC Plot |
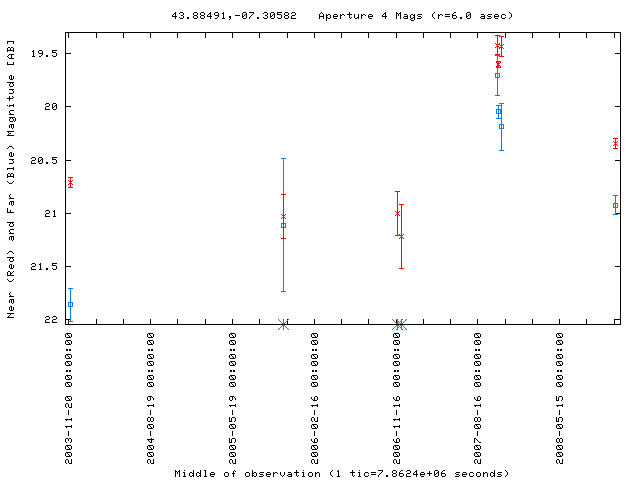
| 2008-11-15 | 43.88491 -07.30582 | 20.92 | 21.86 | 20.34 | 20.71 | SDSS J025532.36-071820.1 | 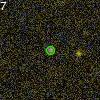 |
LC Plot |
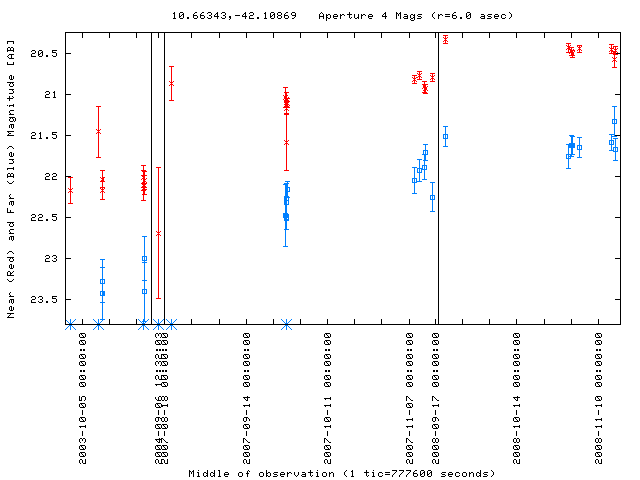
| 2008-11-15 | 10.66343 -42.10869 | 21.34 | 22.17 | 20.58 | 21.11 | - | 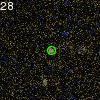 |
LC Plot |
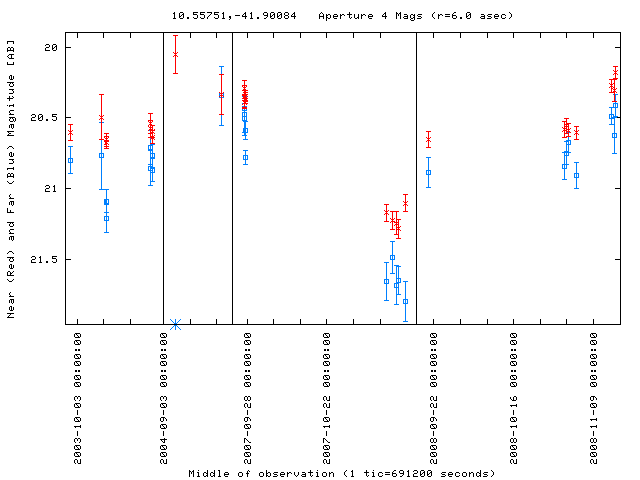
| 2008-11-15 | 10.55751 -41.90084 | 20.62 | 21.80 | 20.31 | 21.10 | - | 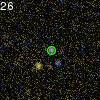 |
LC Plot |
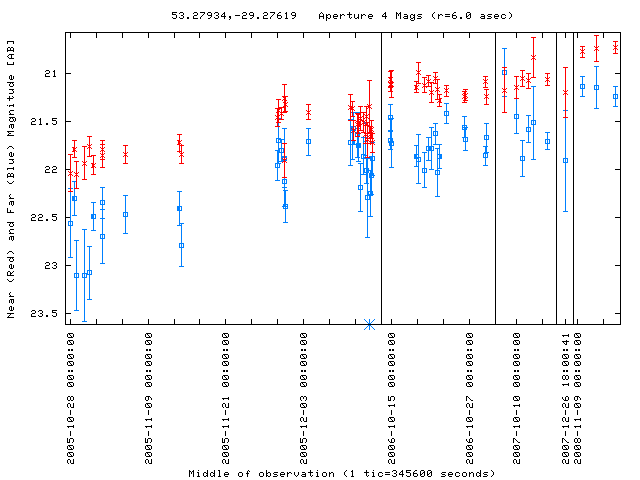
| 2008-11-14 | 53.27934 -29.27619 | 21.25 | 22.39 | 20.73 | 21.32 | - | 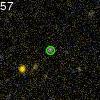 |
LC Plot |
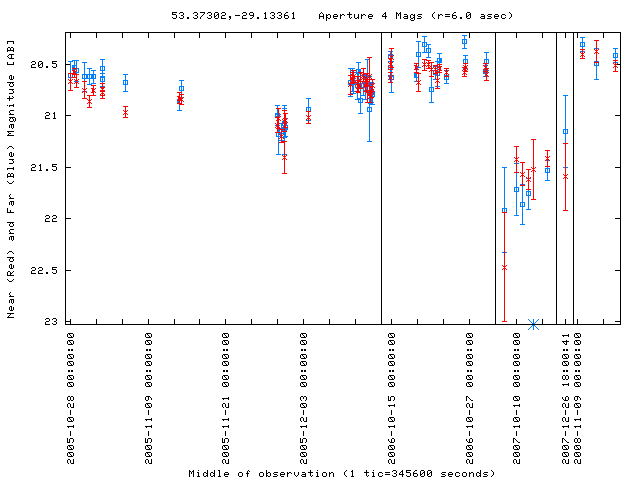
| 2008-11-14 | 53.37302 -29.13361 | 20.42 | 21.35 | 20.52 | 21.56 | APMUKS(BJ) B033125.79-291803.5 | 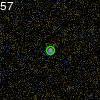 |
LC Plot |
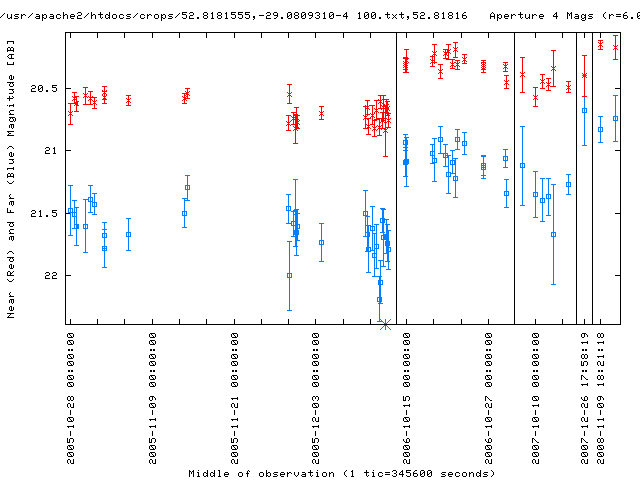
| 2008-11-14 | 52.81816 -29.08093 | 20.92 | 21.79 | 20.11 | 20.81 | - | 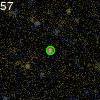 |
LC Plot |
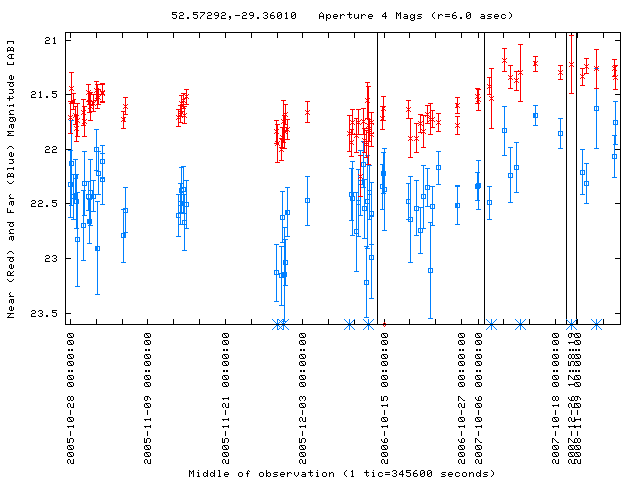
| 2008-11-14 | 52.57292 -29.36010 | 21.76 | 22.61 | 21.34 | 21.71 | - | 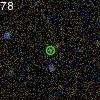 |
LC Plot |
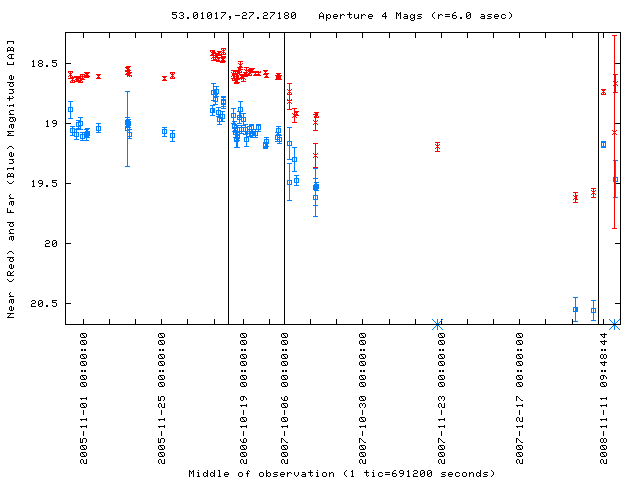
| 2008-11-14 | 53.01017 -27.27180 | 19.46 | 20.56 | 18.67 | 19.58 | GALEX 2518745981243129941 | 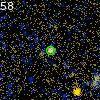 |
LC Plot |
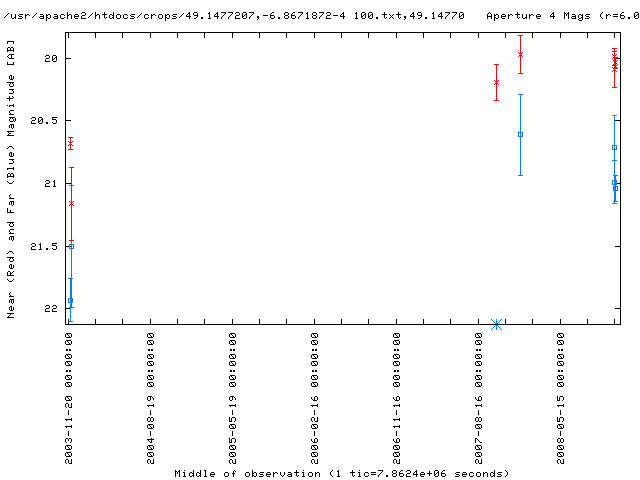
| 2008-11-13 | 49.14770 -06.86716 | 20.99 | 21.93 | 19.99 | 20.68 | SDSS J031635.50-065201.8 | 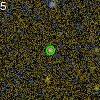 |
LC Plot |
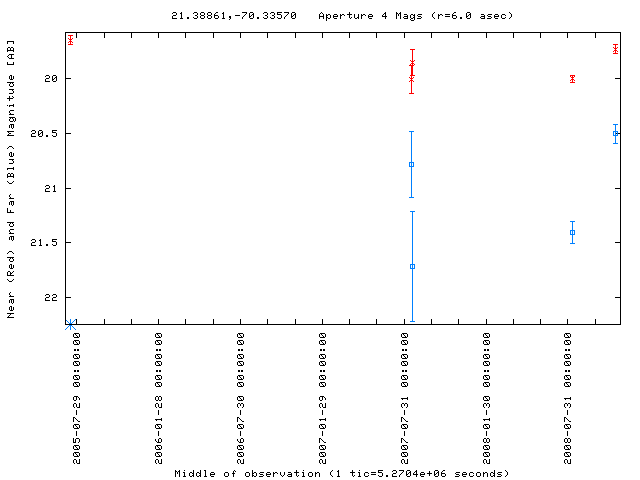
| 2008-11-13 | 21.38861 -70.33570 | 20.50 | 21.41 | 19.73 | 20.00 | - | 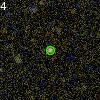 |
LC Plot |
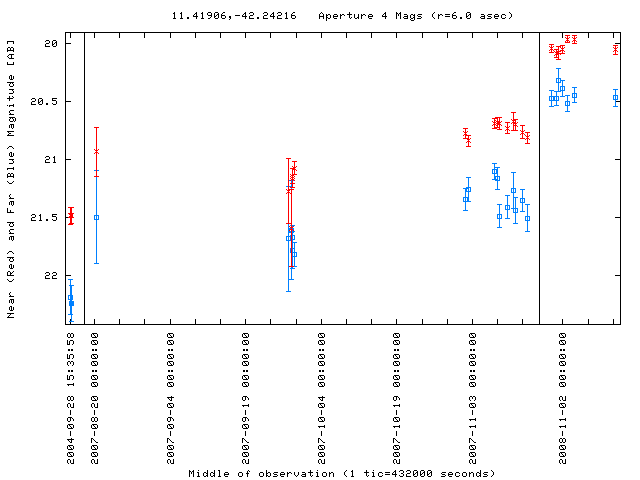
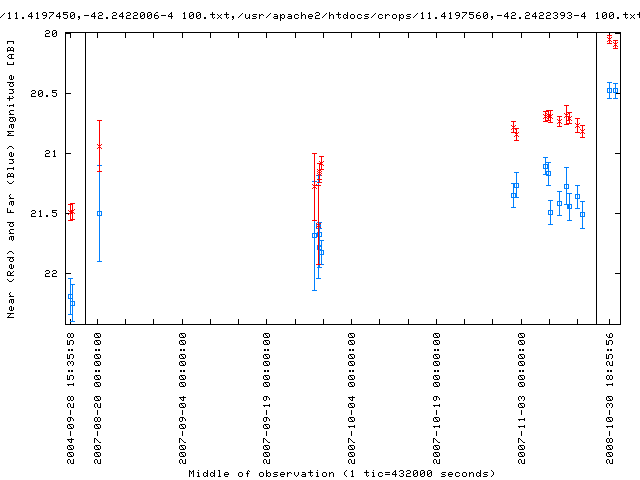
| 2008-11-12 | 11.41906 -42.24216 | 20.47 | 21.67 | 20.06 | 21.15 | - | 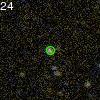 |
LC Plot |
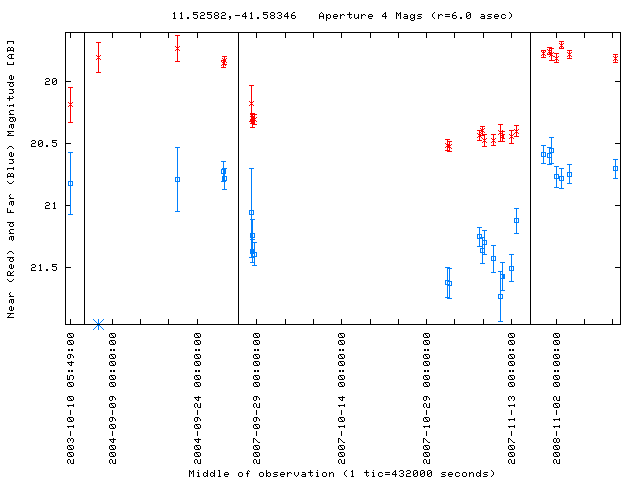
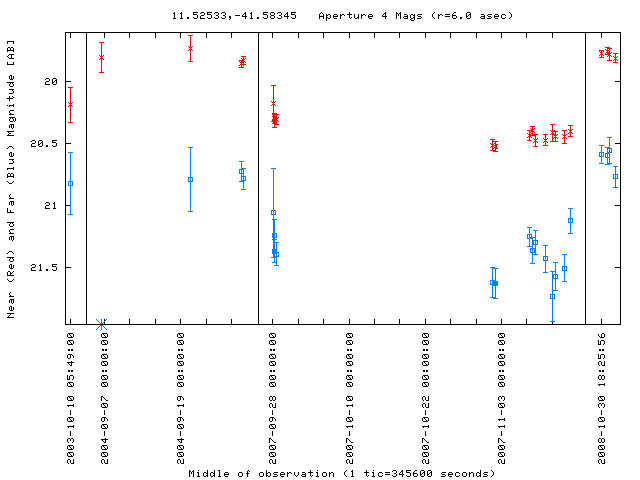
| 2008-11-12 | 11.52582 -41.58346 | 20.71 | 21.63 | 19.82 | 20.53 | - | 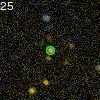 |
LC Plot |
| 2008-11-11 | 52.81814 -29.08094 | 20.74 | 21.84 | 20.17 | 20.83 | - | 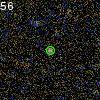 |
LC Plot |
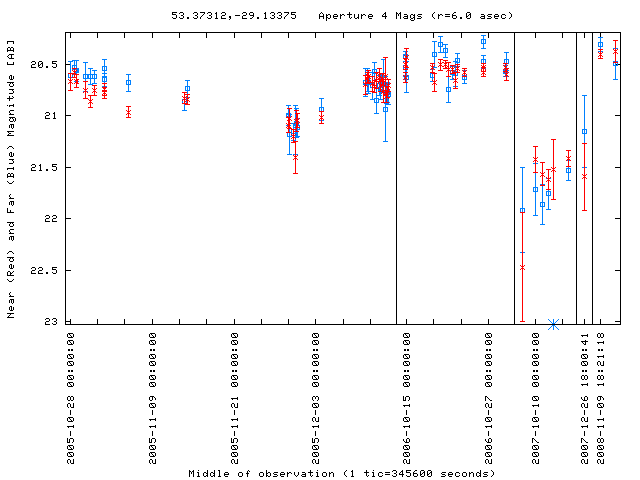
| 2008-11-11 | 53.37312 -29.13375 | 20.50 | 21.53 | 20.38 | 21.42 | APMUKS(BJ) B033125.79-291803.5 | 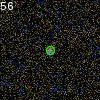 |
LC Plot |
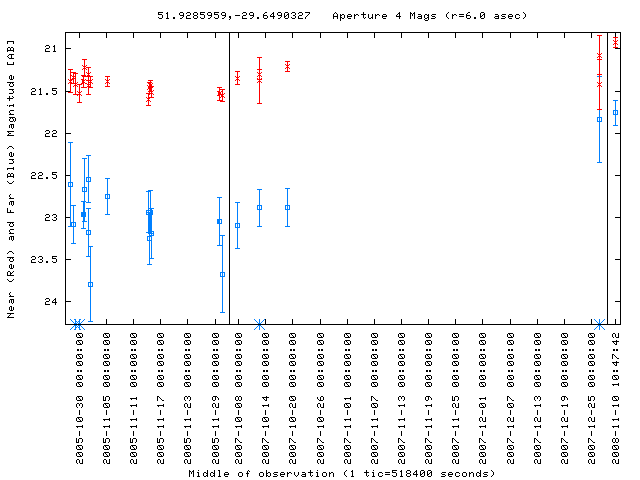
| 2008-11-10 | 51.92860 -29.64903 | 21.76 | 22.97 | 20.92 | 21.38 | - |  |
LC Plot |
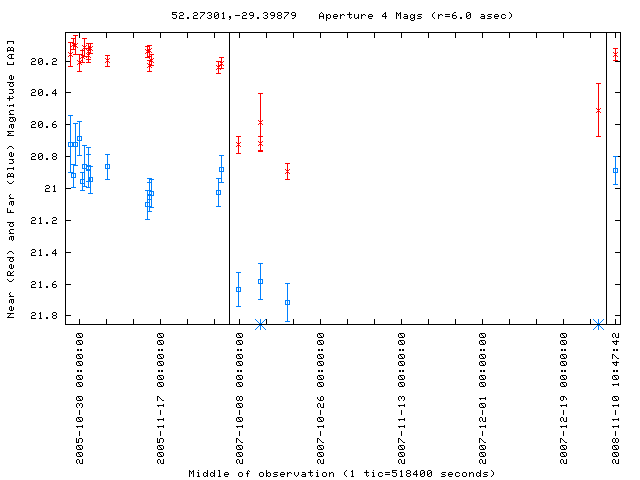
| 2008-11-10 | 52.27301 -29.39879 | 20.89 | 21.72 | 20.16 | 20.89 | - |  |
LC Plot |
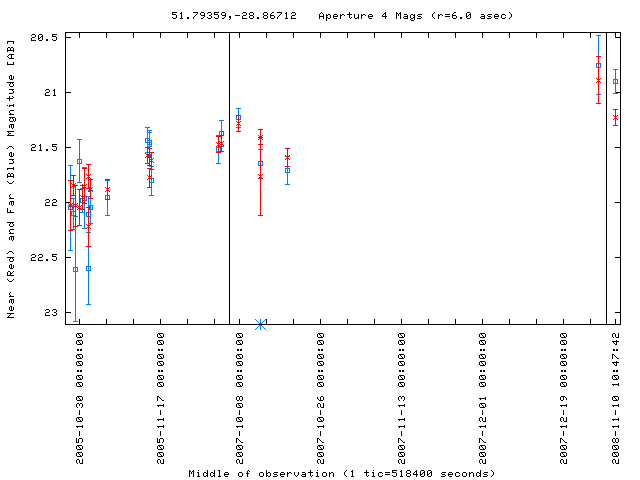
| 2008-11-10 | 51.79359 -28.86712 | 20.90 | 21.80 | 21.23 | 21.62 | APMUKS(BJ) B032505.67-290223.5 |  |
LC Plot |
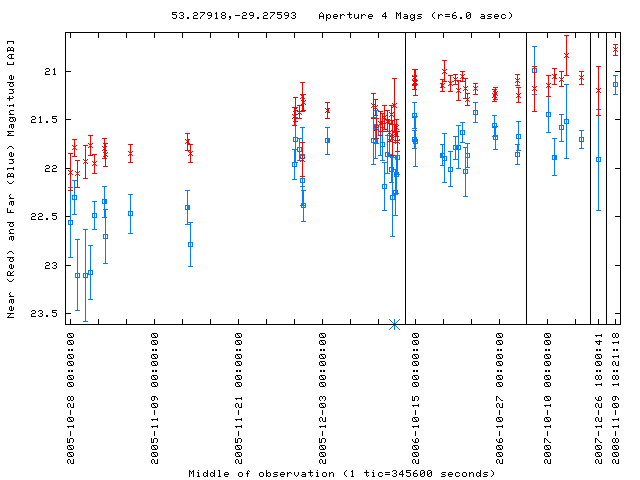
| 2008-11-09 | 53.27918 -29.27593 | 21.14 | 21.89 | 20.78 | 21.72 | - |  |
LC Plot |
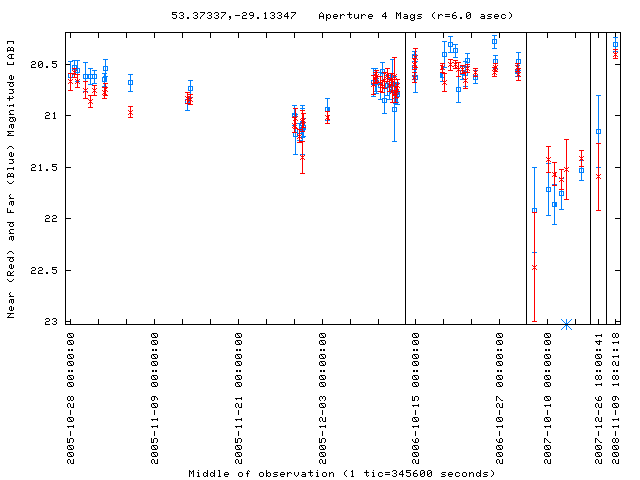
| 2008-11-09 | 53.37337 -29.13347 | 20.31 | 21.18 | 20.40 | 21.03 | APMUKS(BJ) B033125.79-291803.5 | 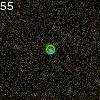 |
LC Plot |
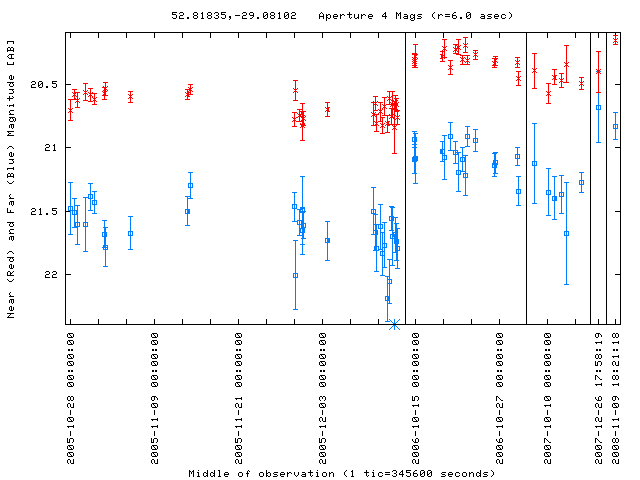
| 2008-11-09 | 52.81835 -29.08102 | 20.83 | 21.77 | 20.15 | 20.68 | - | 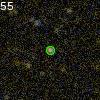 |
LC Plot |
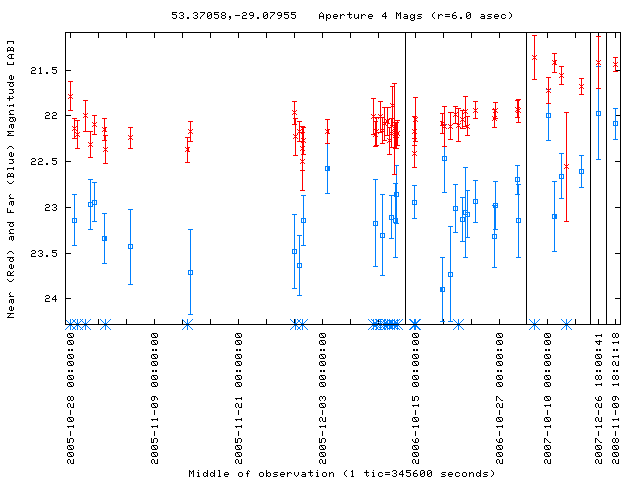
| 2008-11-09 | 53.37058 -29.07955 | 22.09 | 22.94 | 21.44 | 22.41 | - | 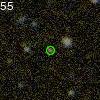 |
LC Plot |
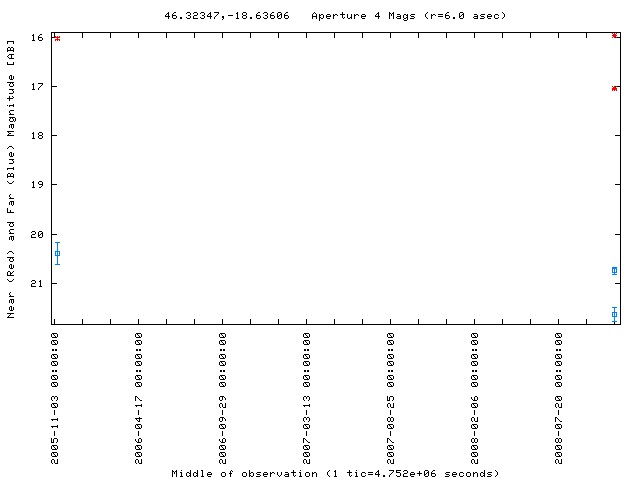
| 2008-11-07 | 46.32347 -18.63606 | 20.75 | 21.65 | 15.96 | 17.05 | V* HX Eri | 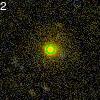 |
LC Plot |
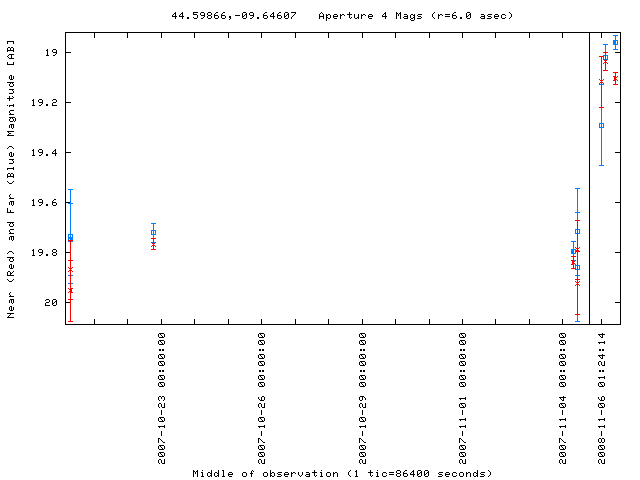
| 2008-11-06 | 44.59866 -09.64607 | 18.96 | 19.75 | 19.10 | 19.95 | - | 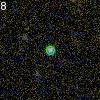 |
LC Plot |
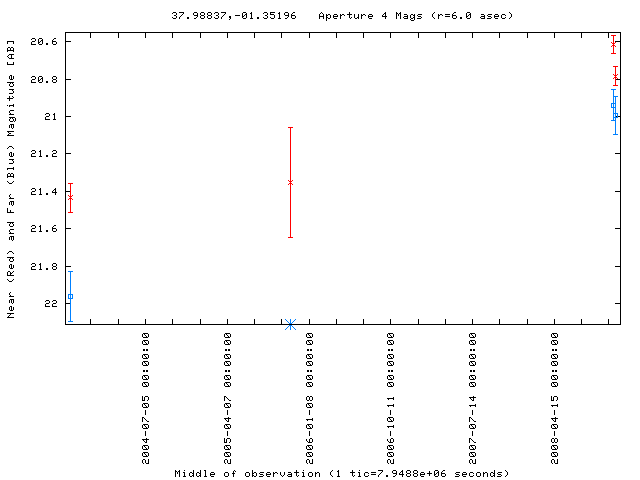
| 2008-11-05 | 37.98837 -01.35196 | 20.99 | 21.96 | 20.78 | 21.44 | - | 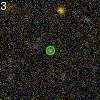 |
LC Plot |
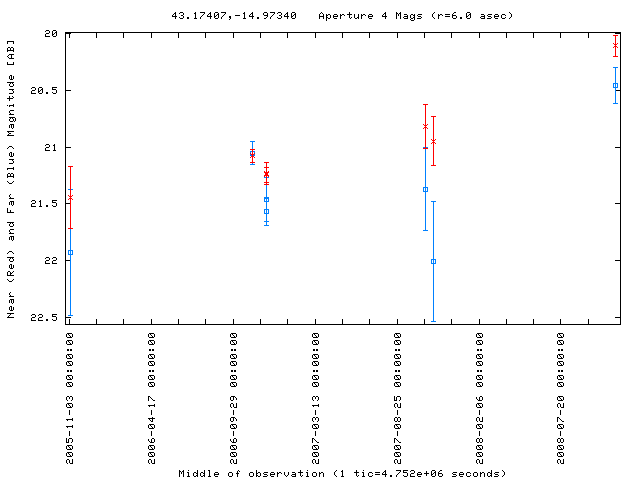
| 2008-11-05 | 43.17407 -14.97340 | 20.46 | 21.57 | 20.11 | 21.24 | APMUKS(BJ) B025020.33-151039.0 | 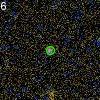 |
LC Plot |
| 2008-11-04 | 11.41976 -42.24224 | 20.45 | 21.67 | 19.97 | 21.15 | - | 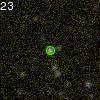 |
LC Plot |
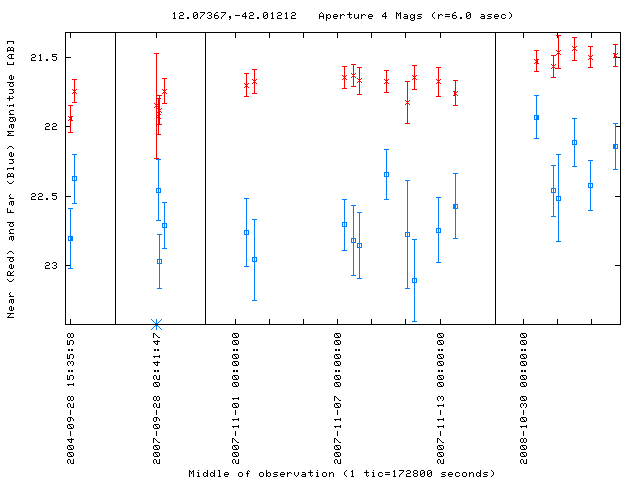
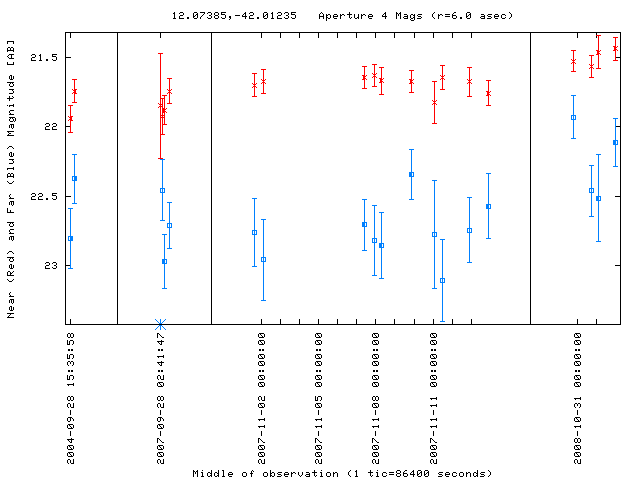
| 2008-11-04 | 12.07367 -42.01212 | 22.14 | 22.97 | 21.49 | 21.88 | - | 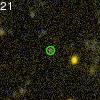 |
LC Plot |
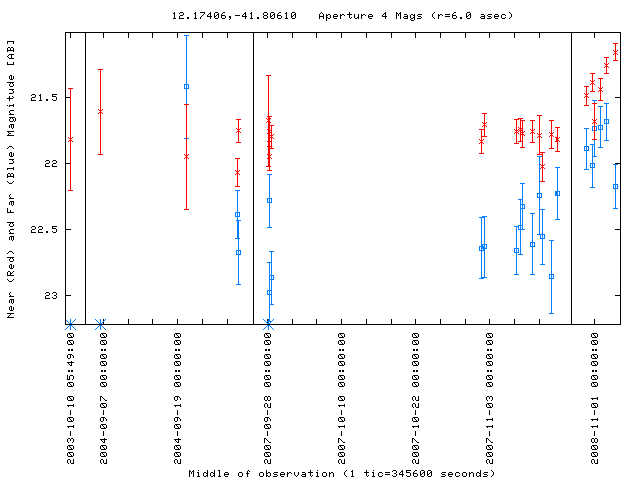
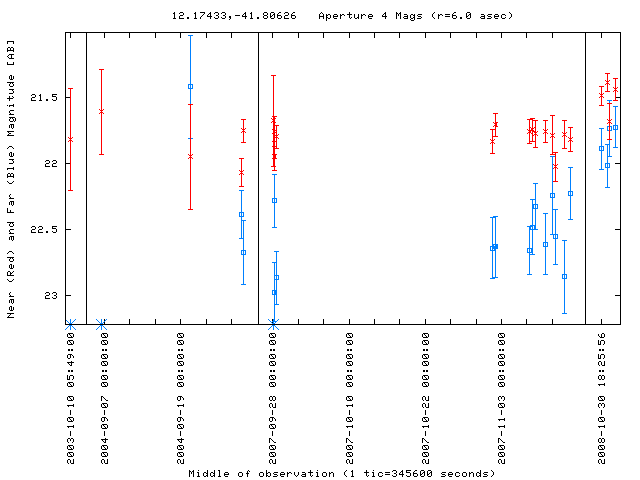
| 2008-11-04 | 12.17406 -41.80610 | 22.17 | 22.39 | 21.16 | 22.07 | APMUKS(BJ) B004620.56-420443.2 | 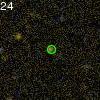 |
LC Plot |
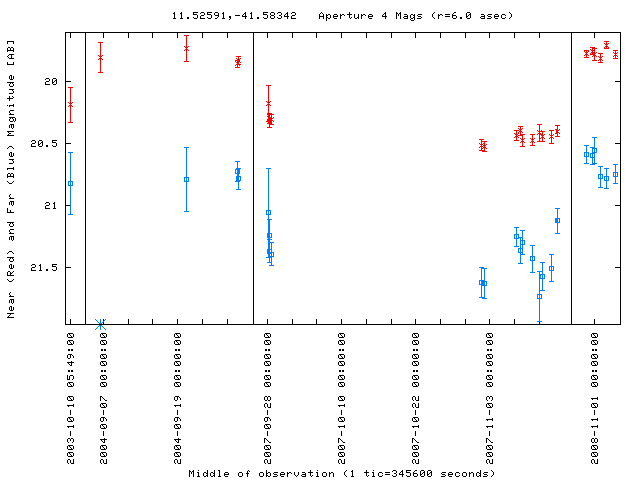
| 2008-11-04 | 11.52591 -41.58342 | 20.75 | 21.63 | 19.78 | 20.52 | - | 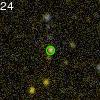 |
LC Plot |
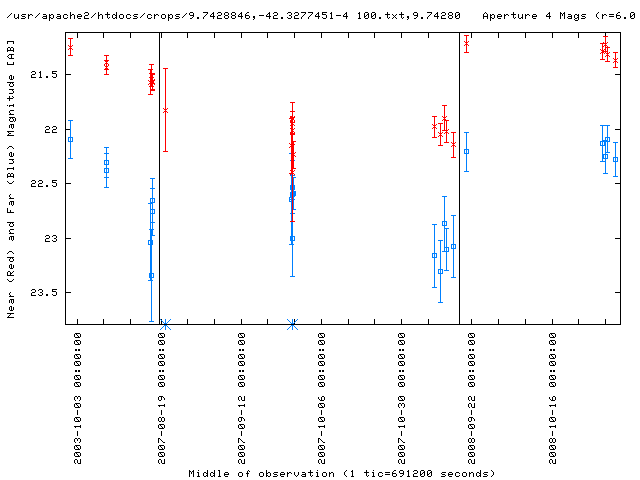
| 2008-11-03 | 9.74280 -42.32745 | 22.28 | 23.10 | 21.36 | 22.02 | - | 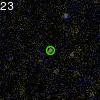 |
LC Plot |
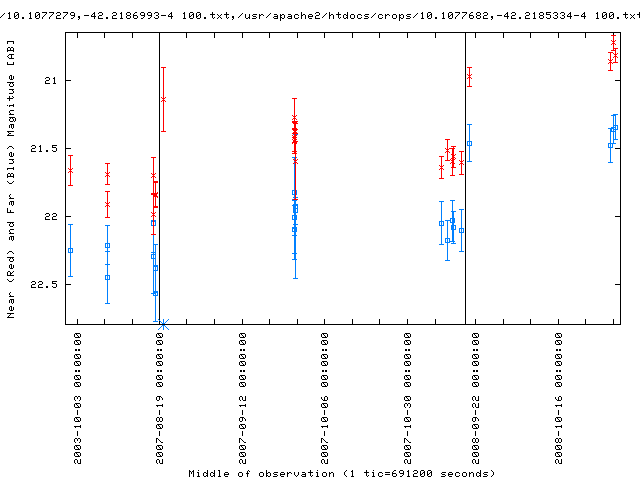
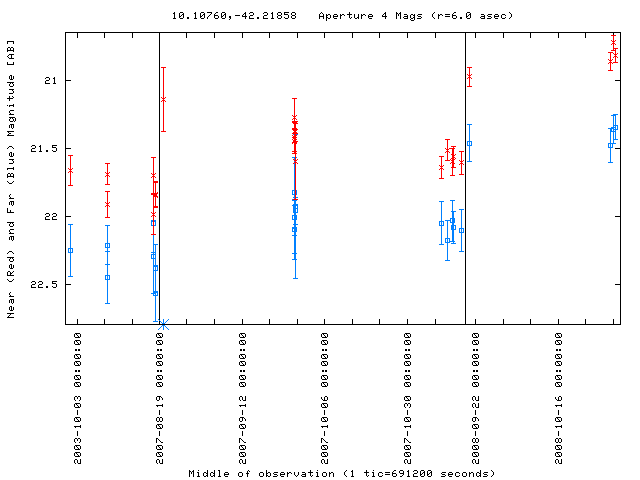
| 2008-11-03 | 10.10760 -42.21858 | 21.07 | 22.45 | 20.69 | 21.91 | - | 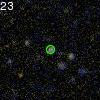 |
LC Plot |
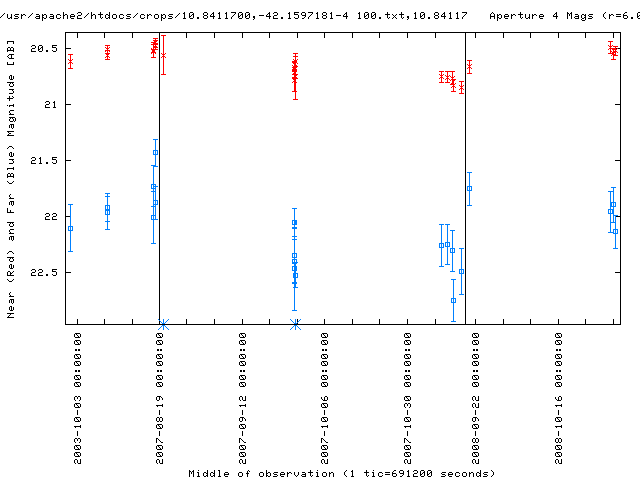
| 2008-11-03 | 10.84117 -42.15972 | 21.56 | 22.40 | 20.57 | 20.67 | - | 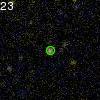 |
LC Plot |
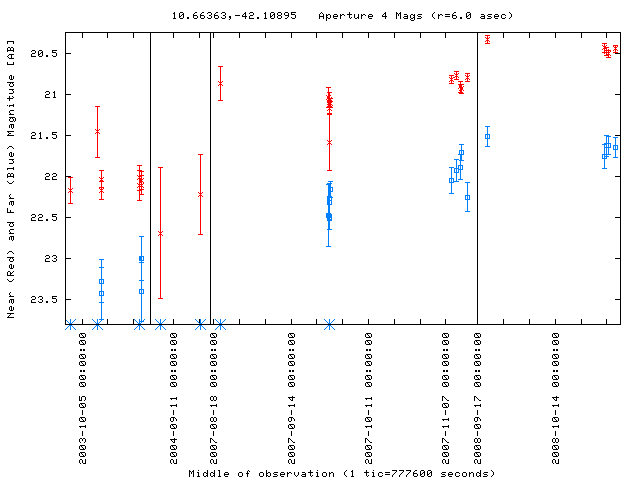
| 2008-11-03 | 10.66363 -42.10895 | 21.65 | 22.50 | 20.45 | 21.11 | - | 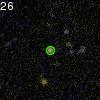 |
LC Plot |
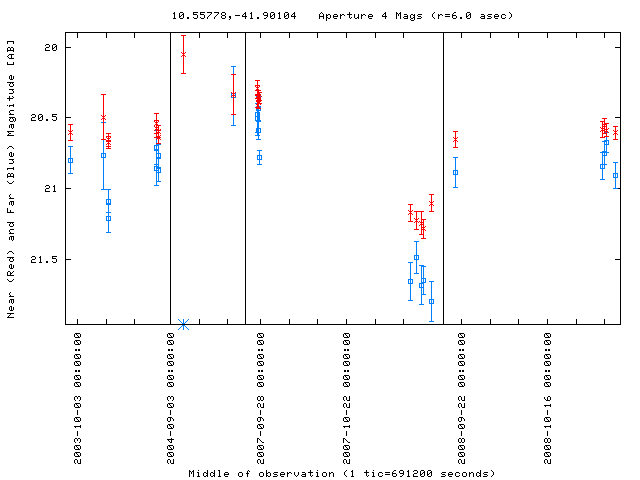
| 2008-11-03 | 10.55778 -41.90104 | 20.91 | 21.80 | 20.61 | 21.10 | - | 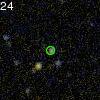 |
LC Plot |
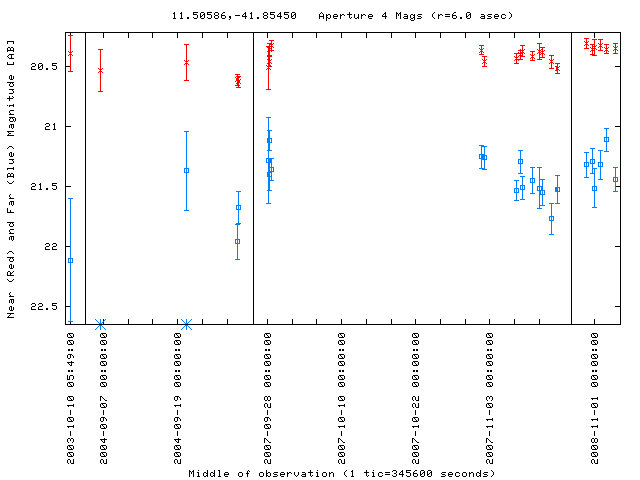
| 2008-11-02 | 11.50586 -41.85450 | 21.11 | 21.96 | 20.36 | 20.61 | - | 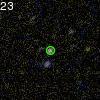 |
LC Plot |
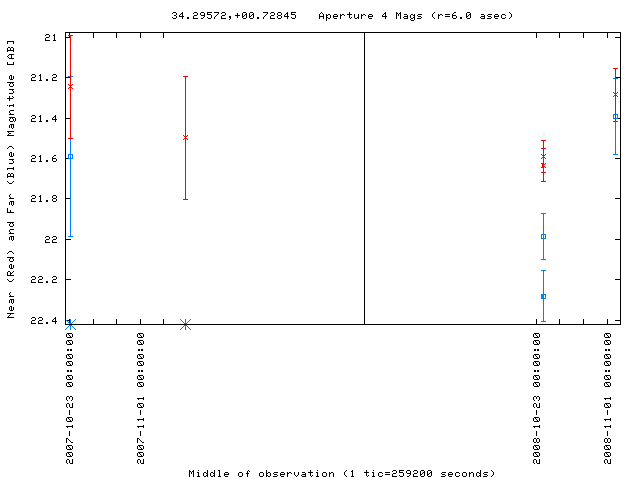
| 2008-11-02 | 34.29572 +00.72845 | 21.39 | 22.28 | 21.28 | 21.63 | APMUKS(BJ) B021436.81+002950.0 | 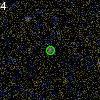 |
LC Plot |
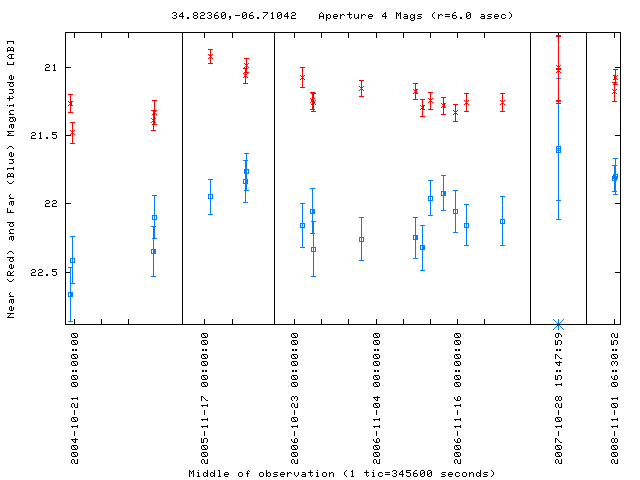
| 2008-11-01 | 34.82360 -06.71042 | 21.80 | 22.66 | 21.07 | 21.27 | - | 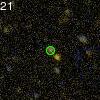 |
LC Plot |
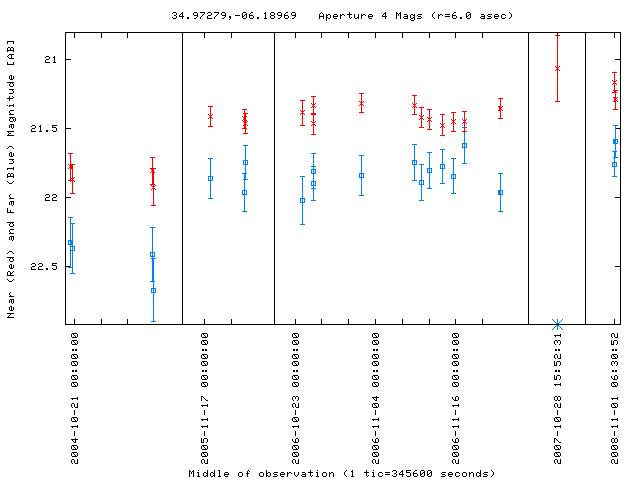
| 2008-11-01 | 34.97279 -06.18969 | 21.59 | 22.42 | 21.29 | 21.81 | - | 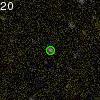 |
LC Plot |
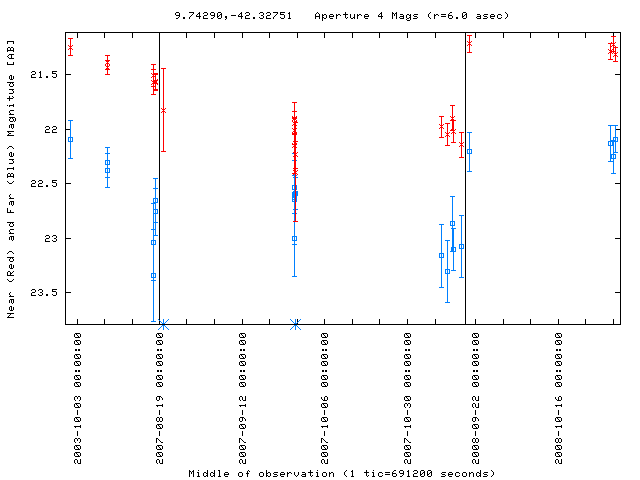
| 2008-11-01 | 9.74290 -42.32751 | 22.09 | 23.10 | 21.32 | 22.02 | - | 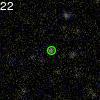 |
LC Plot |
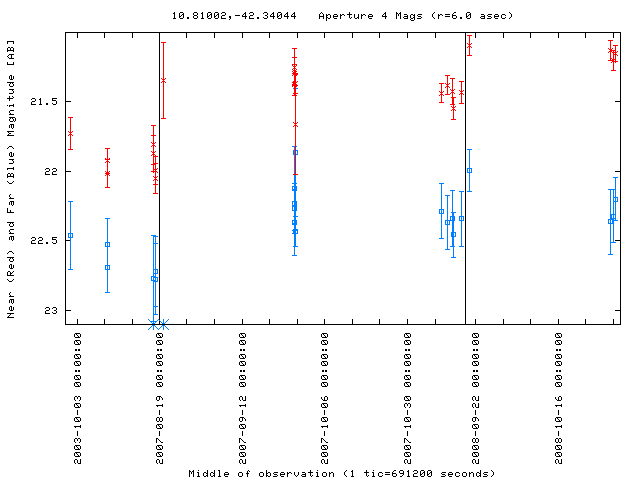
| 2008-11-01 | 10.81002 -42.34044 | 22.20 | 22.53 | 21.16 | 22.02 | APMUKS(BJ) B004051.87-423650.3 | 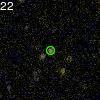 |
LC Plot |
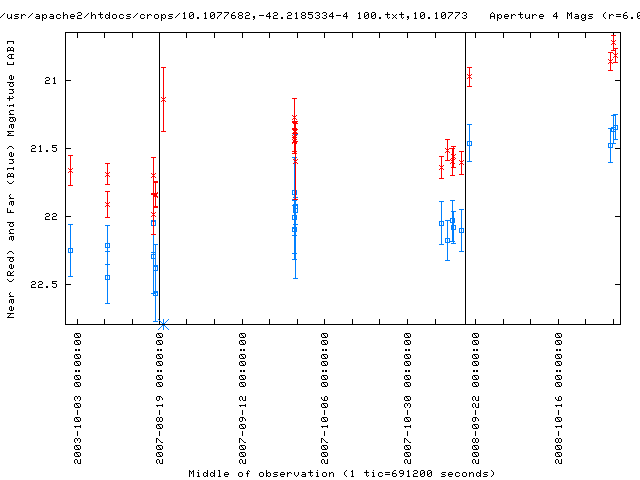
| 2008-11-01 | 10.10773 -42.21861 | 21.35 | 22.38 | 20.82 | 21.85 | - | 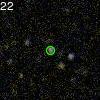 |
LC Plot |
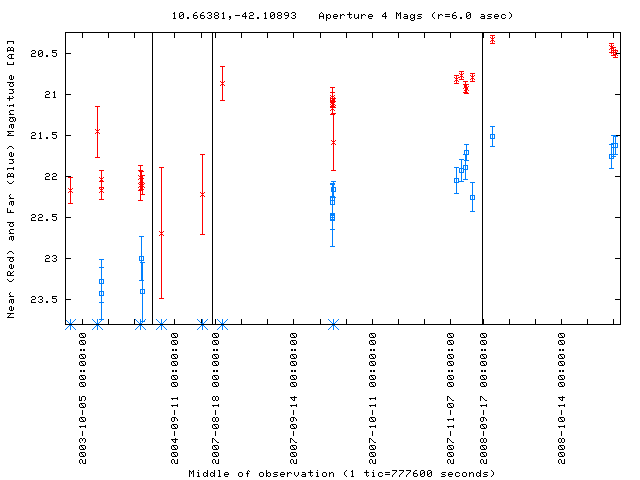
| 2008-11-01 | 10.66381 -42.10893 | 21.63 | 22.50 | 20.51 | 21.11 | - | 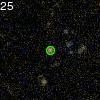 |
LC Plot |
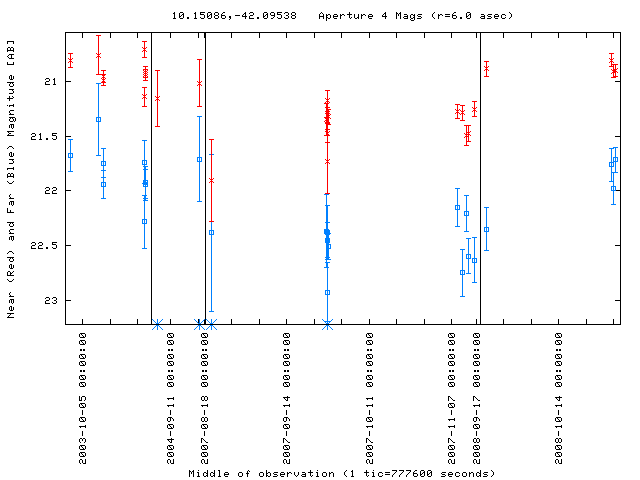
| 2008-11-01 | 10.15086 -42.09538 | 21.72 | 22.59 | 20.90 | 21.48 | - | 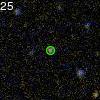 |
LC Plot |
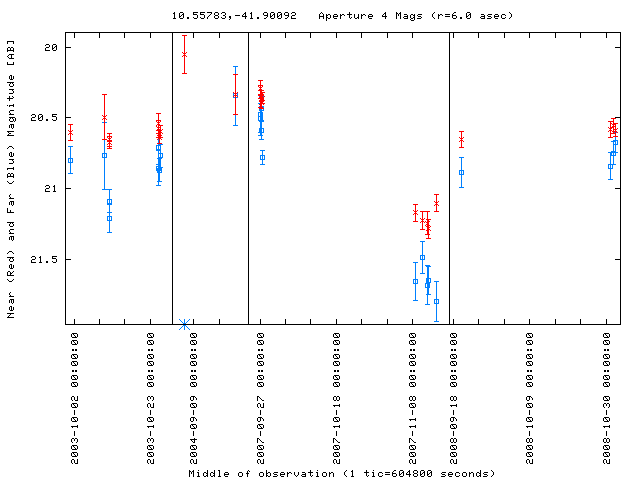
| 2008-11-01 | 10.55783 -41.90092 | 20.67 | 21.66 | 20.59 | 21.17 | - | 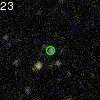 |
LC Plot |
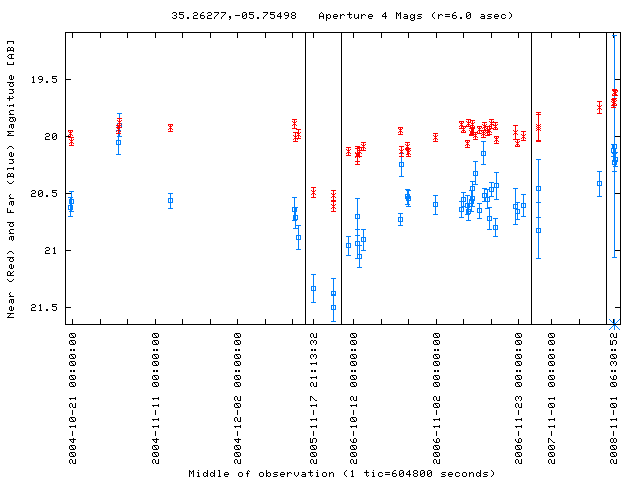
| 2008-11-01 | 35.26277 -05.75498 | 20.20 | 21.05 | 19.62 | 20.13 | - | 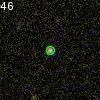 |
LC Plot |
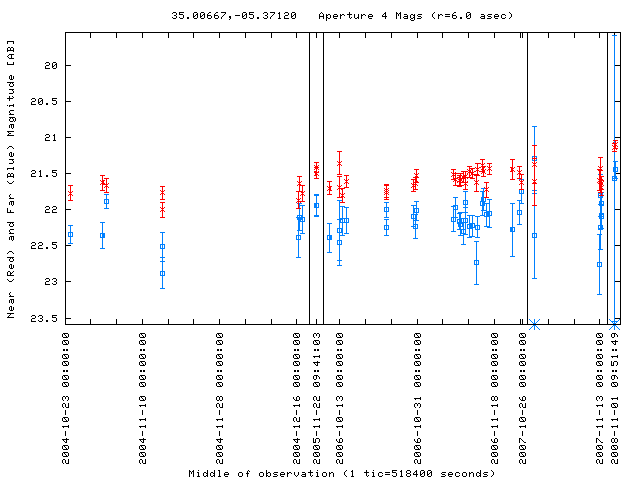
| 2008-11-01 | 35.00667 -05.37120 | 21.45 | 22.35 | 21.09 | 21.62 | - | 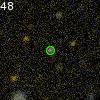 |
LC Plot |
| 2008-11-01 | 35.31140 -05.14257 | 21.30 | 22.30 | 20.31 | 20.84 | - | 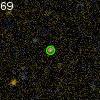 |
LC Plot |
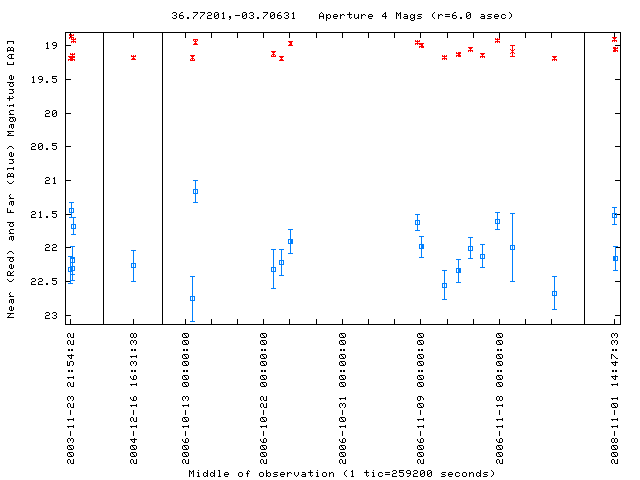
| 2008-11-01 | 36.77201 -03.70631 | 21.53 | 22.34 | 18.90 | 19.13 | HE 0224-0355 | 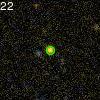 |
LC Plot |
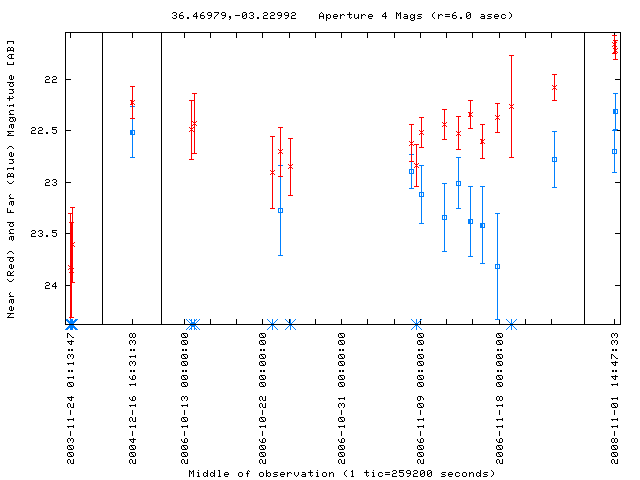
| 2008-11-01 | 36.46979 -03.22992 | 22.31 | 22.89 | 21.72 | 22.62 | - | 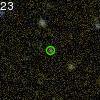 |
LC Plot |
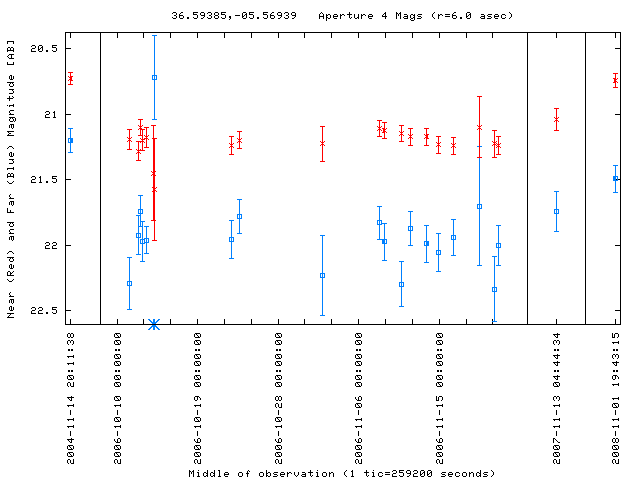
| 2008-11-01 | 36.59385 -05.56939 | 21.49 | 22.29 | 20.74 | 21.19 | - | 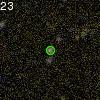 |
LC Plot |
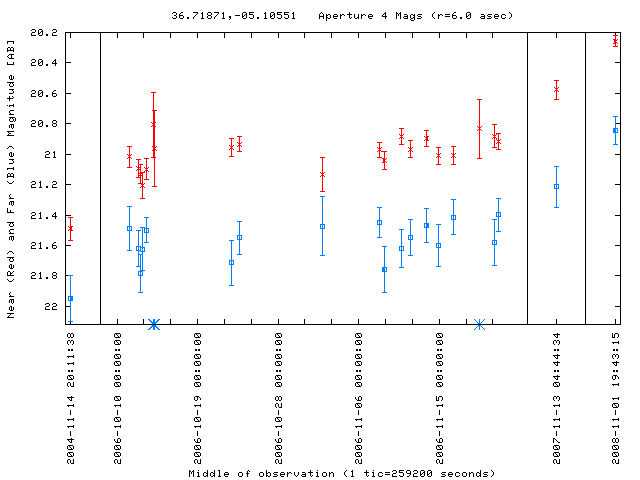
| 2008-11-01 | 36.71871 -05.10551 | 20.84 | 21.76 | 20.26 | 21.04 | - | 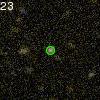 |
LC Plot |
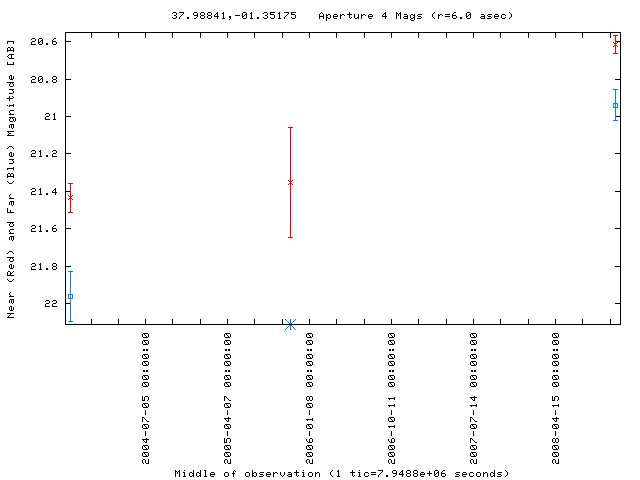
| 2008-11-01 | 37.98841 -01.35175 | 20.94 | 21.96 | 20.61 | 21.44 | - | 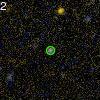 |
LC Plot |
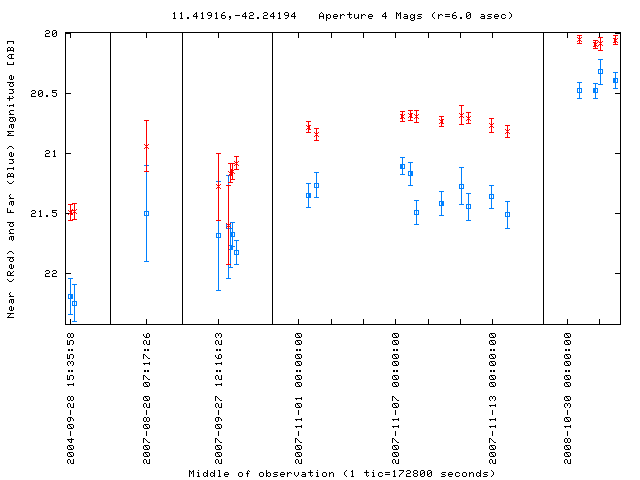
| 2008-11-01 | 11.41916 -42.24194 | 20.39 | 21.67 | 20.06 | 21.15 | - | 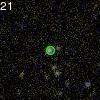 |
LC Plot |
| 2008-11-01 | 12.07385 -42.01235 | 22.11 | 22.97 | 21.44 | 21.88 | - | 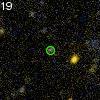 |
LC Plot |
| 2008-11-01 | 12.17433 -41.80626 | 21.72 | 22.66 | 21.44 | 21.76 | APMUKS(BJ) B004620.56-420443.2 |  |
LC Plot |
| 2008-11-01 | 11.52533 -41.58345 | 20.77 | 21.63 | 19.81 | 20.53 | - |  |
LC Plot |
Archive Navigation: Monthly Archive | Current

