

GALEX TDS Alerts Archive: Sep 2008
Archive Navigation: Monthly Archive | Current
New GALEX observations are checked for variable sources every 24 hours by the GALEX science team. Alerts for validated variable sources will be posted on this page.
The GALEX variable alert notices from Sep., 2008 are listed below. Clicking the coordinates will perform a search of the SIMBAD database within 5 arseconds of the position. Clicking on the name of identified objects brings up the SIMBAD database entry for galactic objects and the NED database entry for extragalactic objects.
NOTES: GI data were not checked for variables.
DATE |
Coordinate (J2000) |
latest FUV |
earlier FUV |
latest NUV |
earlier NUV |
Identification |
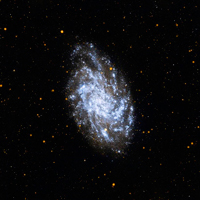
NUV:FUV Cutout |
Light Curve |
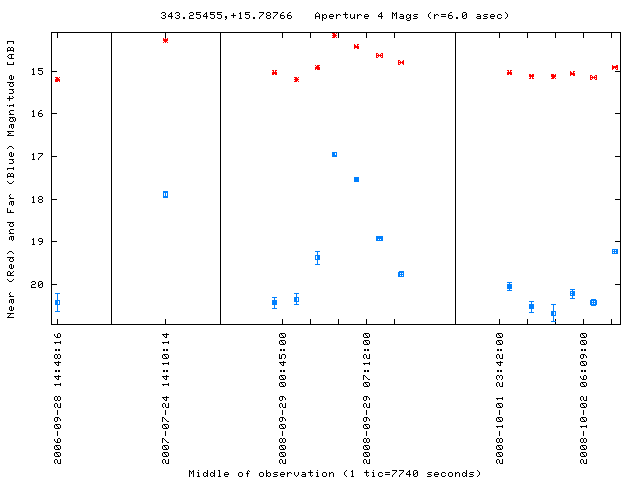
| 2008-09-29 | 343.25455 +15.78766 | 19.77 | 20.68 | 14.80 | 15.12 | V* BH Peg | 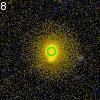 |
LC Plot |
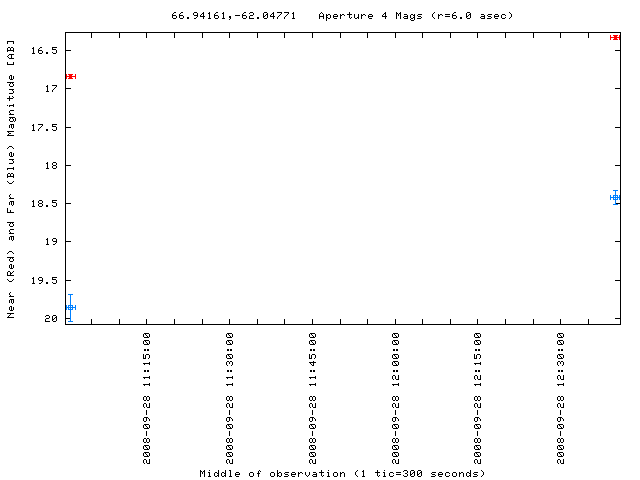
| 2008-09-28 | 66.94161 -62.04771 | 18.42 | 19.86 | 16.32 | 16.84 | - | 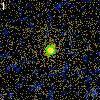 |
LC Plot |
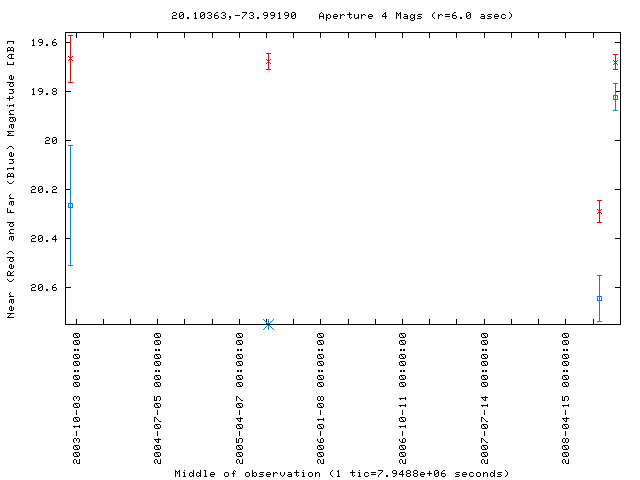
| 2008-09-28 | 20.10363 -73.99190 | 19.82 | 20.64 | 19.68 | 20.29 | - | 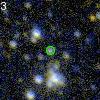 |
LC Plot |
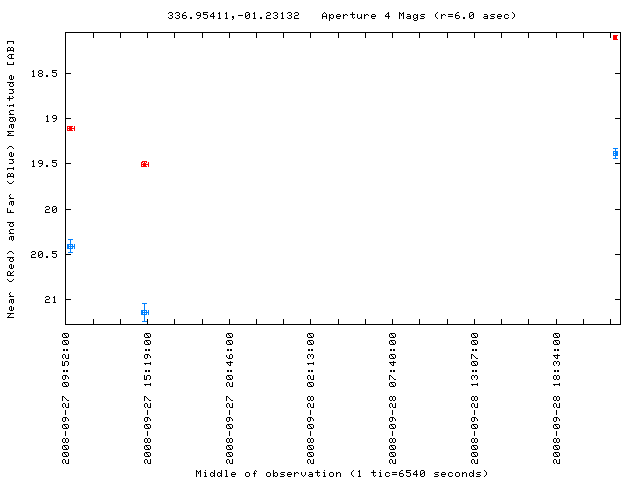
| 2008-09-28 | 336.95411 -01.23132 | 19.39 | 21.14 | 18.11 | 19.70 | - | 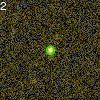 |
LC Plot |
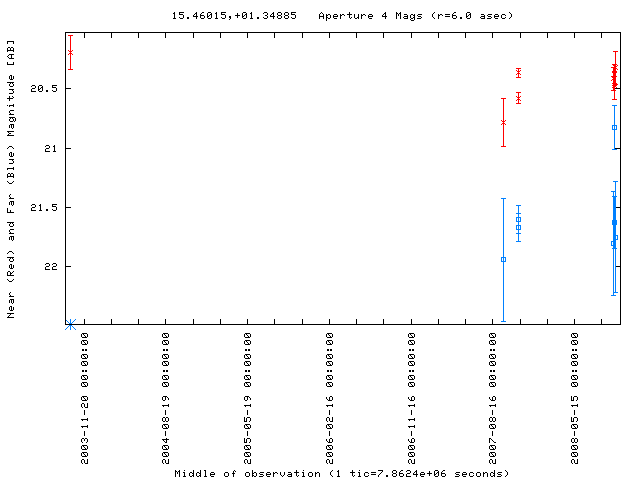
| 2008-09-26 | 15.46015 +01.34885 | 20.82 | 21.67 | 20.47 | 20.36 | - | 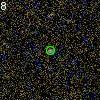 |
LC Plot |
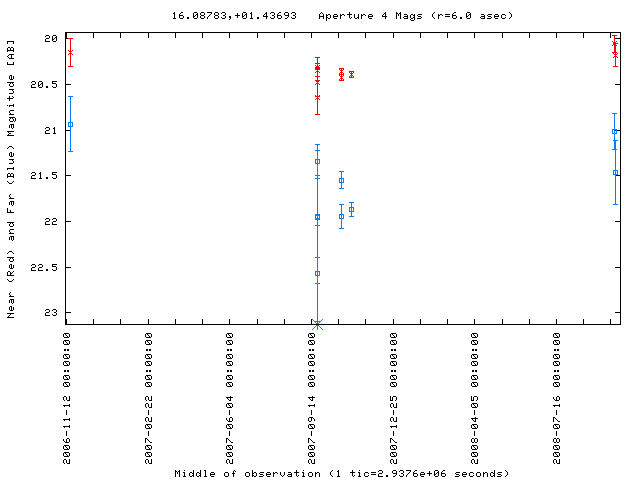
| 2008-09-26 | 16.08783 +01.43693 | 21.02 | 21.94 | 20.06 | 20.36 | - | 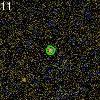 |
LC Plot |
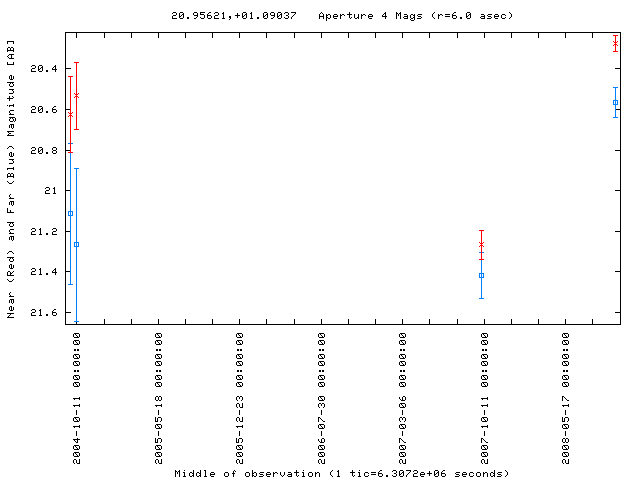
| 2008-09-26 | 20.95621 +01.09037 | 20.56 | 21.42 | 20.28 | 21.27 | SDSS J012349.52+010524.5 | 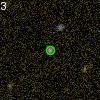 |
LC Plot |
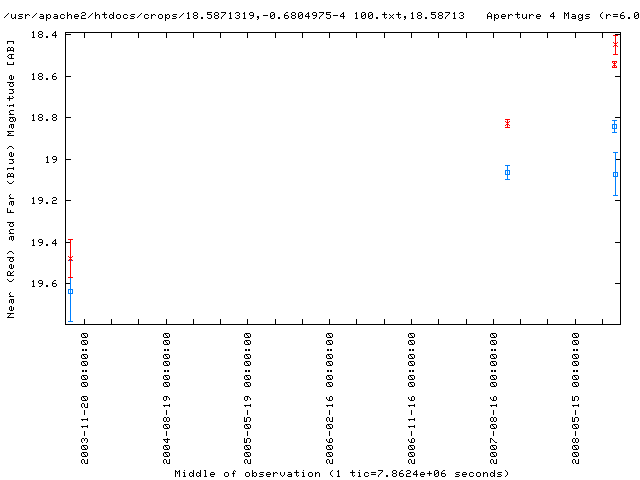
| 2008-09-26 | 18.58713 -00.68050 | 18.77 | 19.64 | 18.48 | 19.48 | SDSS J011420.95-004049.3 | 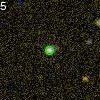 |
LC Plot |
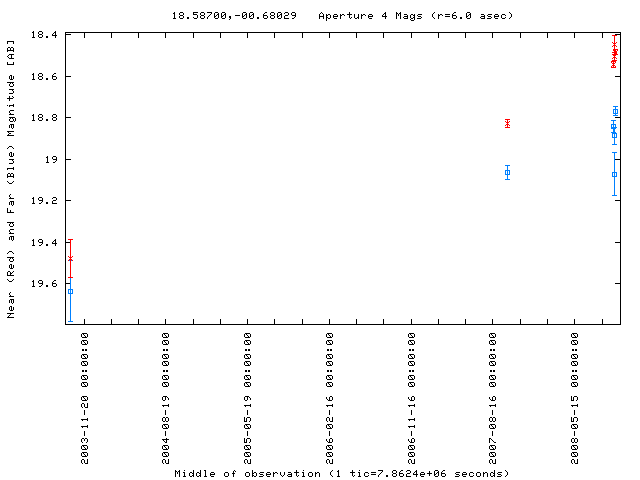
| 2008-09-25 | 18.58700 -00.68029 | 18.89 | 19.64 | 18.50 | 19.48 | SDSS J011420.95-004049.3 | 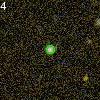 |
LC Plot |
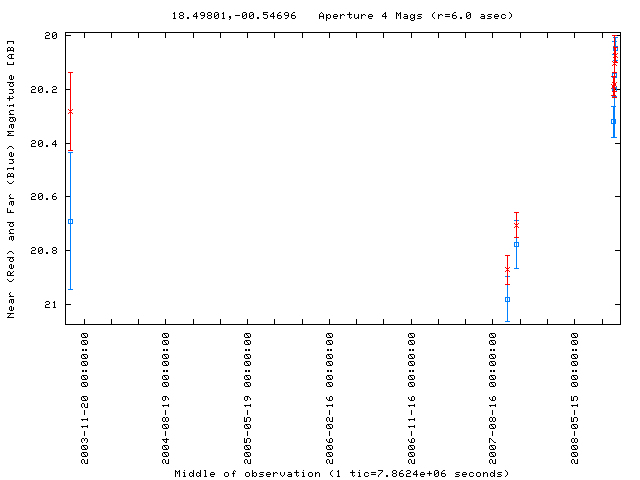
| 2008-09-25 | 18.49801 -00.54696 | 20.15 | 20.98 | 20.18 | 20.87 | SDSS J011359.53-003248.6 | 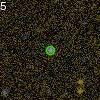 |
LC Plot |
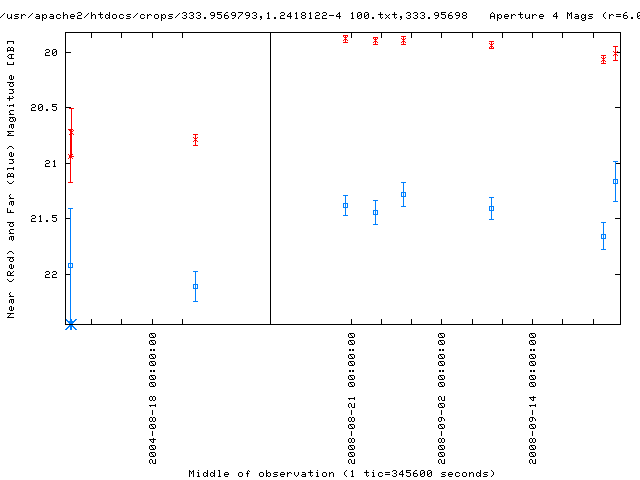
| 2008-09-25 | 333.95698 +01.24181 | 21.54 | 22.11 | 19.95 | 20.79 | GALEX 2470648944597669894 | 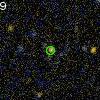 |
LC Plot |
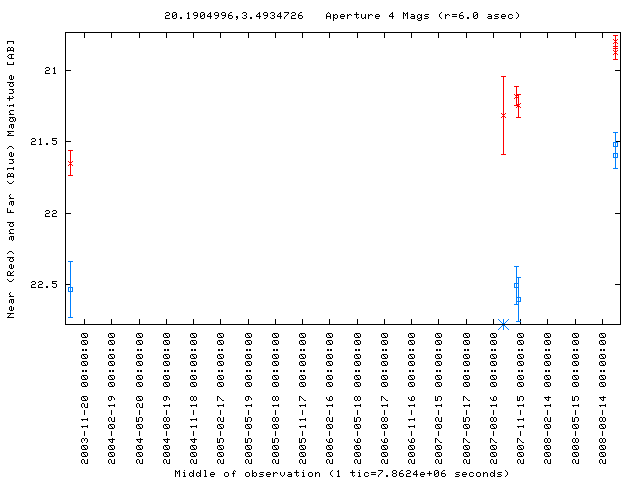
| 2008-09-25 | 20.19050 +03.49347 | 21.60 | 22.54 | 20.88 | 21.65 | - |  |
LC Plot |
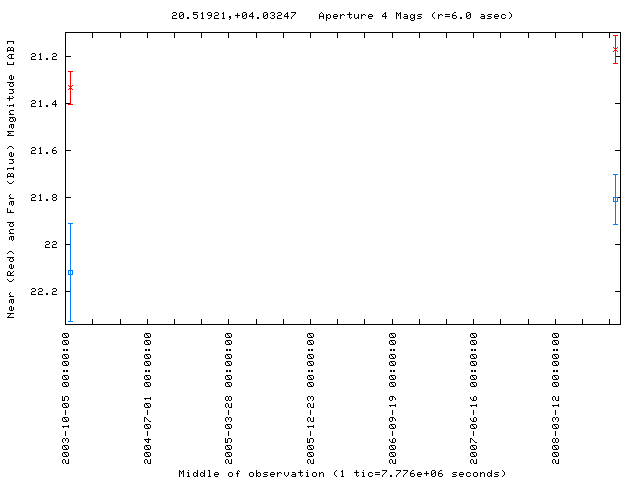
| 2008-09-25 | 20.51921 +04.03247 | 21.81 | 22.74 | 21.17 | 21.54 | - |  |
LC Plot |
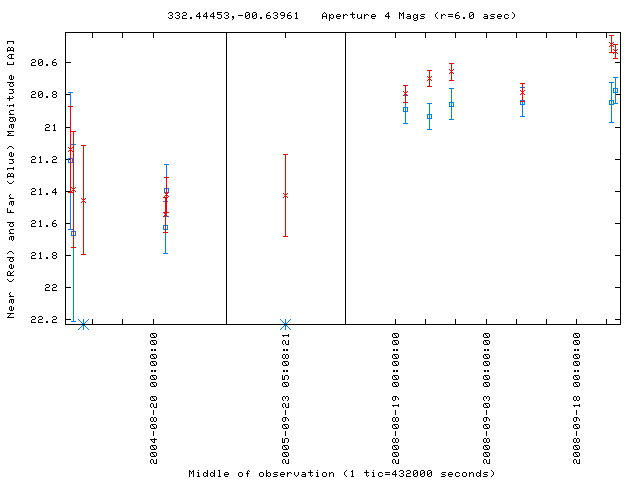
| 2008-09-24 | 332.44453 -00.63961 | 20.77 | 21.39 | 20.53 | 21.42 | - |  |
LC Plot |
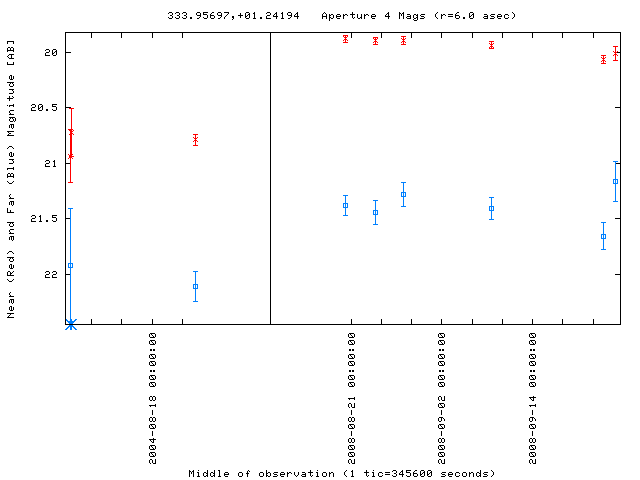
| 2008-09-24 | 333.95697 +01.24194 | 21.17 | 22.11 | 20.01 | 20.79 | GALEX 2470648944597669894 |  |
LC Plot |
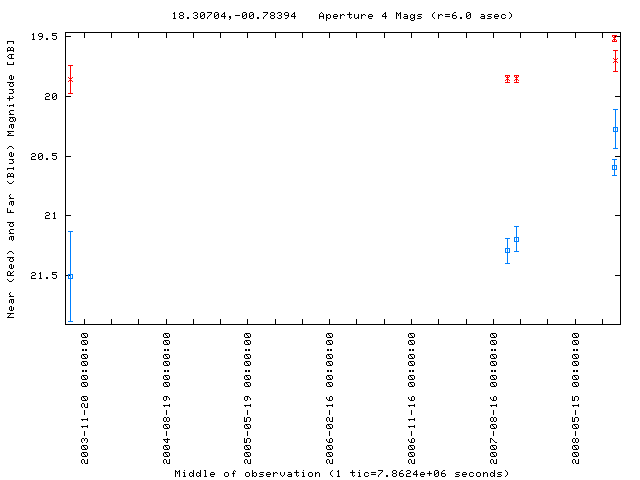
| 2008-09-24 | 18.30704 -00.78394 | 20.28 | 21.20 | 19.70 | 19.86 | SDSS J011313.78-004701.3 | 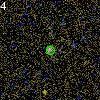 |
LC Plot |
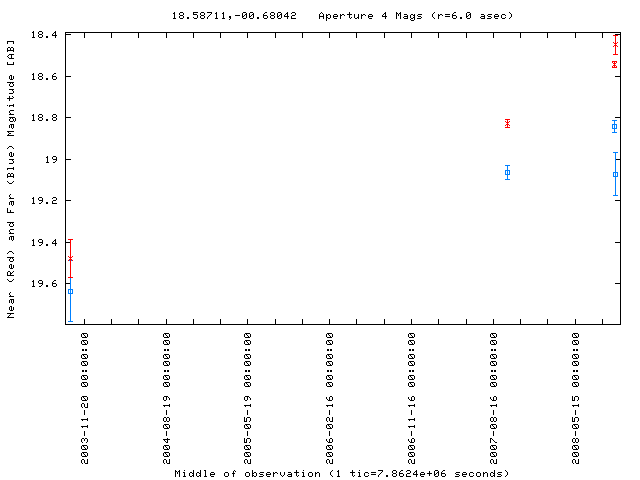
| 2008-09-24 | 18.58711 -00.68042 | 19.07 | 19.64 | 18.45 | 19.48 | SDSS J011420.95-004049.3 | 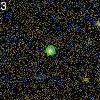 |
LC Plot |
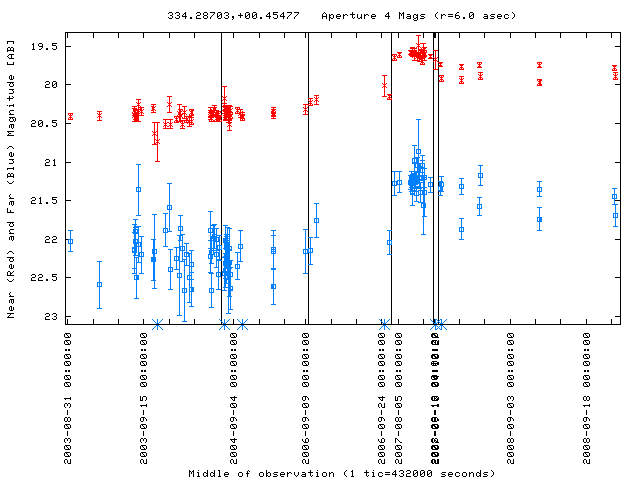
| 2008-09-23 | 334.28703 +00.45477 | 21.44 | 22.46 | 19.78 | 20.39 | SDSS J221708.83+002717.1 | 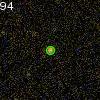 |
LC Plot |
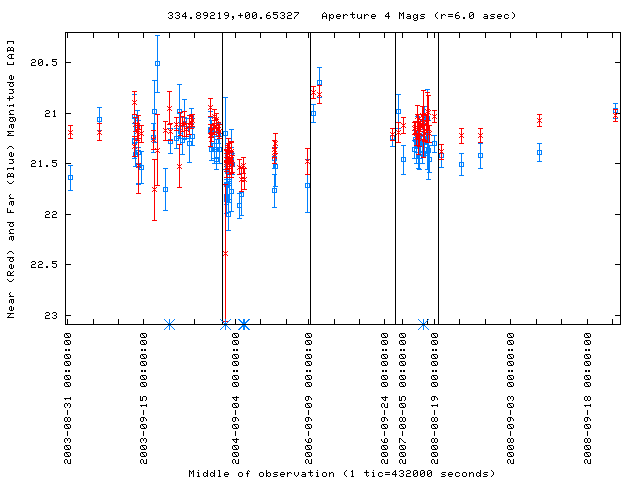
| 2008-09-23 | 334.89219 +00.65327 | 20.98 | 21.82 | 21.02 | 21.49 | - | 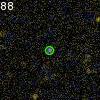 |
LC Plot |
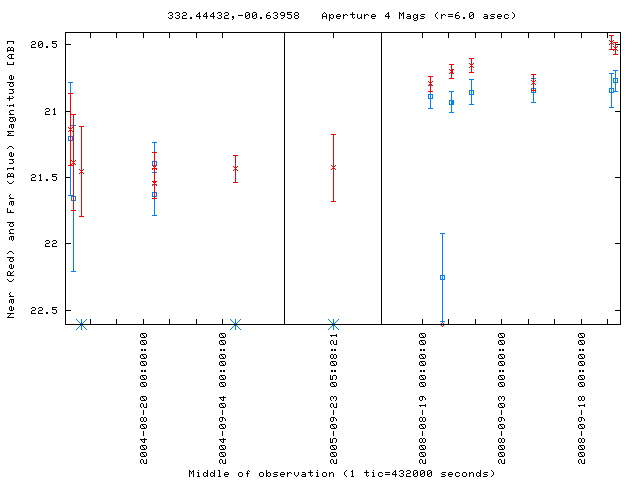
| 2008-09-23 | 332.44432 -00.63958 | 20.85 | 21.63 | 20.48 | 21.55 | - | 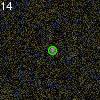 |
LC Plot |
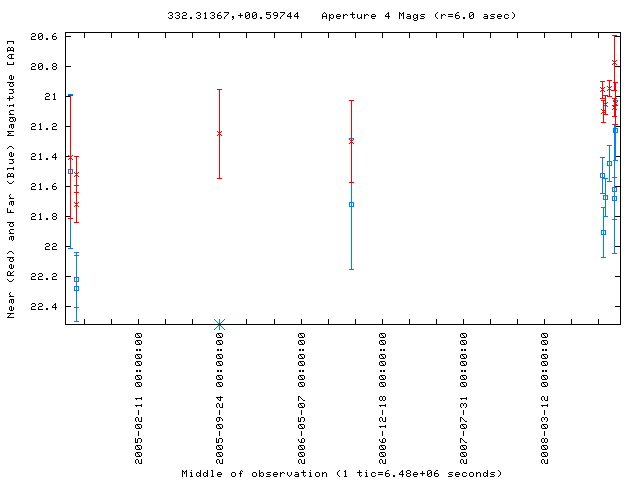
| 2008-09-23 | 332.31367 +00.59744 | 21.23 | 22.22 | 21.05 | 21.52 | - | 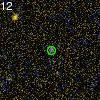 |
LC Plot |
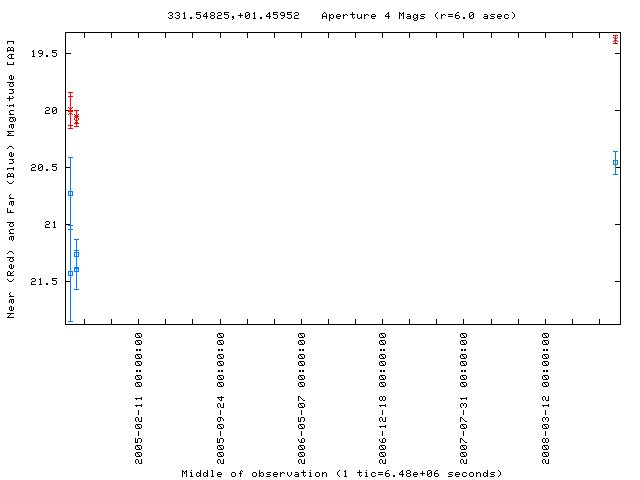
| 2008-09-21 | 331.54825 +01.45952 | 20.46 | 21.39 | 19.38 | 20.06 | - | 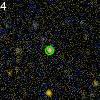 |
LC Plot |
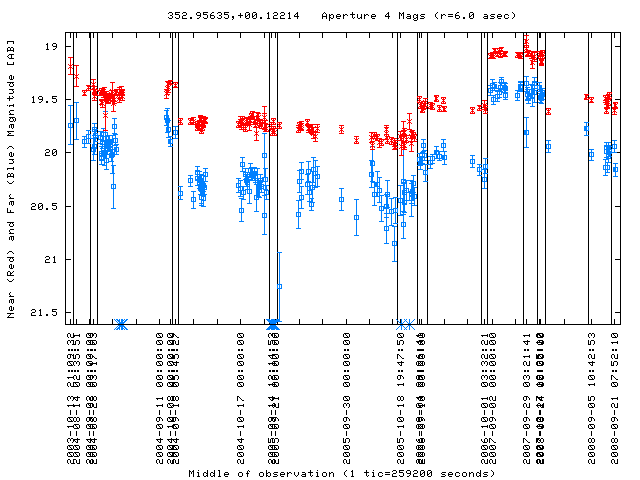
| 2008-09-21 | 352.95635 +00.12214 | 19.94 | 20.85 | 19.60 | 19.92 | SDSS J233149.48+000719.4 | 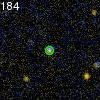 |
LC Plot |
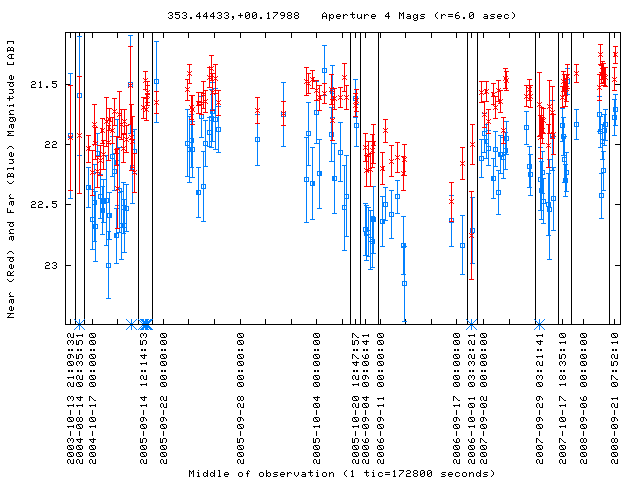
| 2008-09-21 | 353.44433 +00.17988 | 21.77 | 22.58 | 21.46 | 22.14 | DEEP2 33031391 | 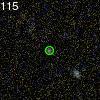 |
LC Plot |
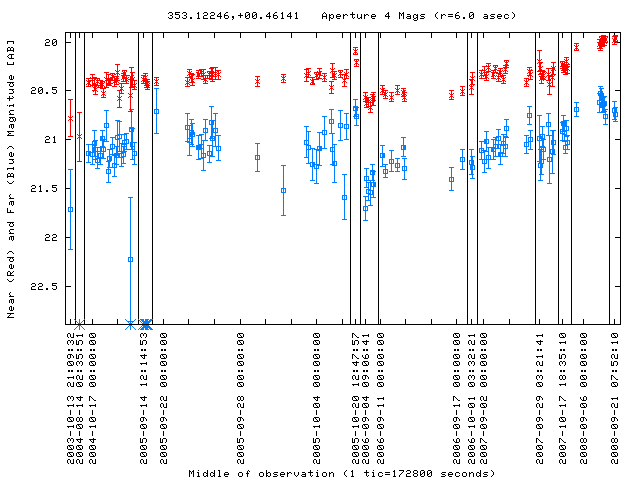
| 2008-09-21 | 353.12246 +00.46141 | 20.70 | 21.53 | 19.99 | 20.61 | SDSS J233229.37+002740.3 | 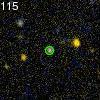 |
LC Plot |
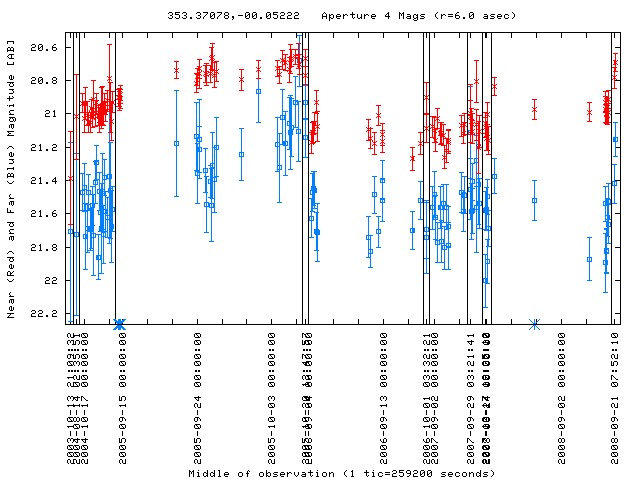
| 2008-09-21 | 353.37078 -00.05222 | 21.15 | 22.00 | 20.69 | 21.06 | SDSS J233329.00-000308.1 | 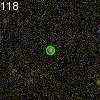 |
LC Plot |
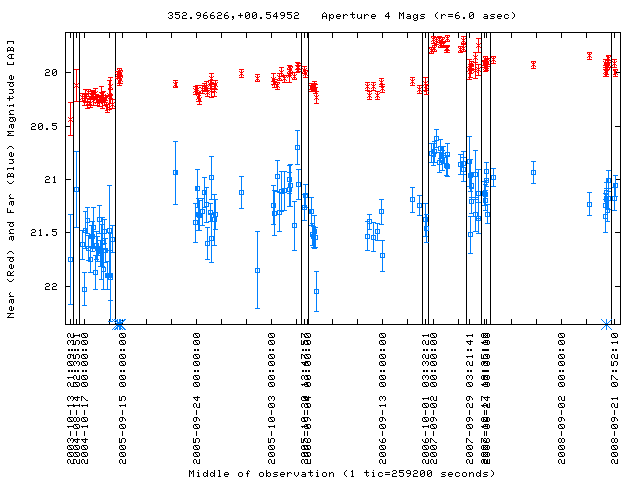
| 2008-09-21 | 352.96626 +00.54952 | 21.06 | 22.03 | 20.00 | 20.25 | SDSS J233151.91+003258.3 | 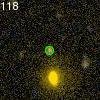 |
LC Plot |
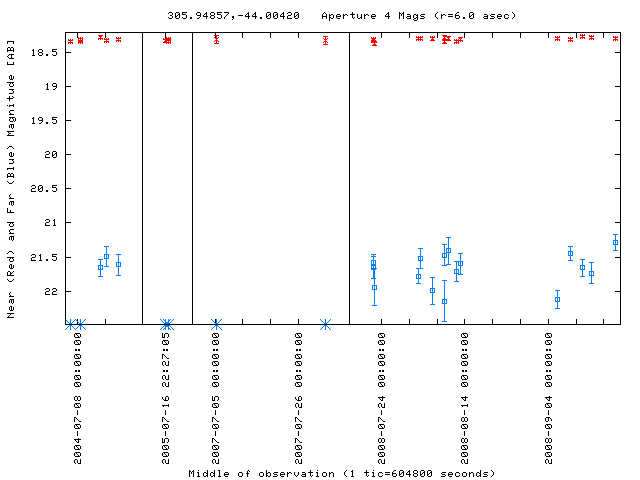
| 2008-09-20 | 305.94857 -44.00420 | 21.28 | 22.11 | 18.30 | 18.30 | - | 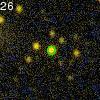 |
LC Plot |
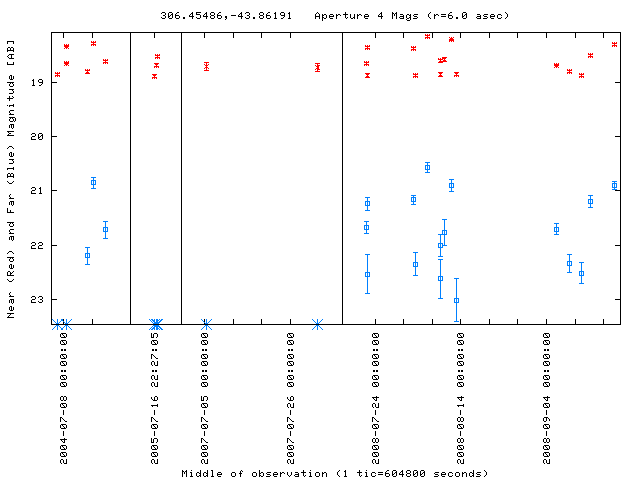
| 2008-09-20 | 306.45486 -43.86191 | 20.90 | 21.70 | 18.30 | 18.68 | - | 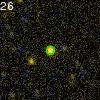 |
LC Plot |
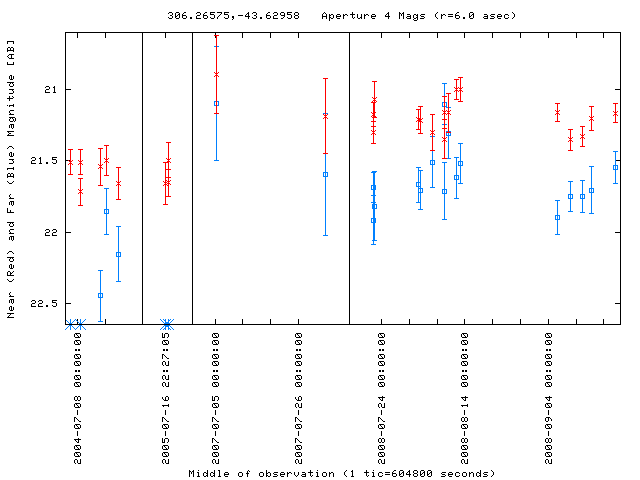
| 2008-09-20 | 306.26575 -43.62958 | 21.55 | 22.44 | 21.16 | 21.54 | - | 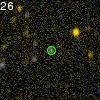 |
LC Plot |
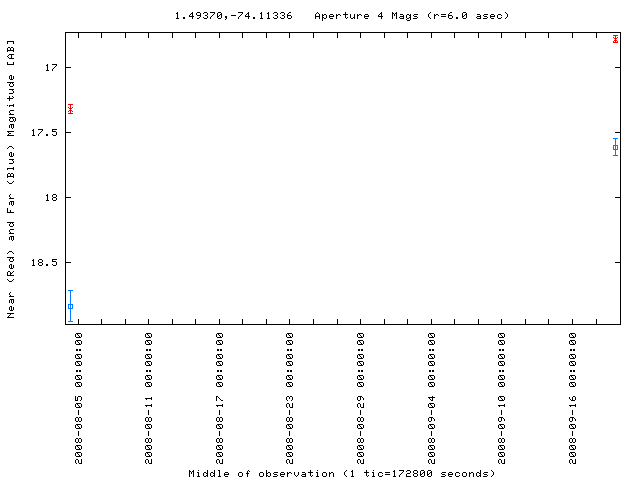
| 2008-09-19 | 1.49370 -74.11336 | 17.62 | 18.83 | 16.79 | 17.32 | V* UW Tuc | 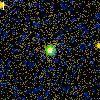 |
LC Plot |
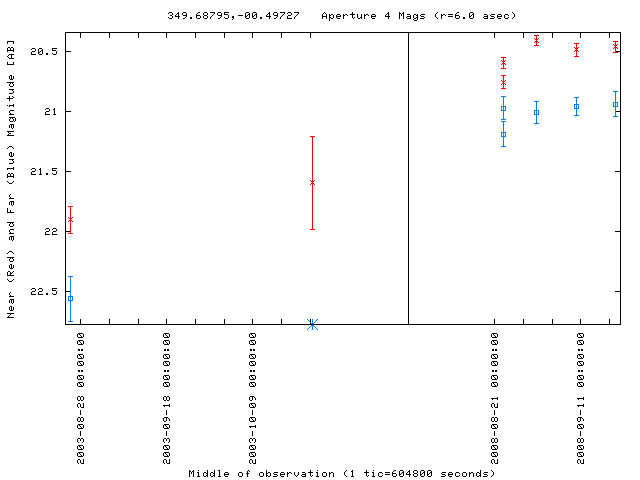
| 2008-09-19 | 349.68795 -00.49727 | 20.94 | 22.56 | 20.46 | 21.91 | SDSS J231845.12-002951.4 | 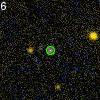 |
LC Plot |
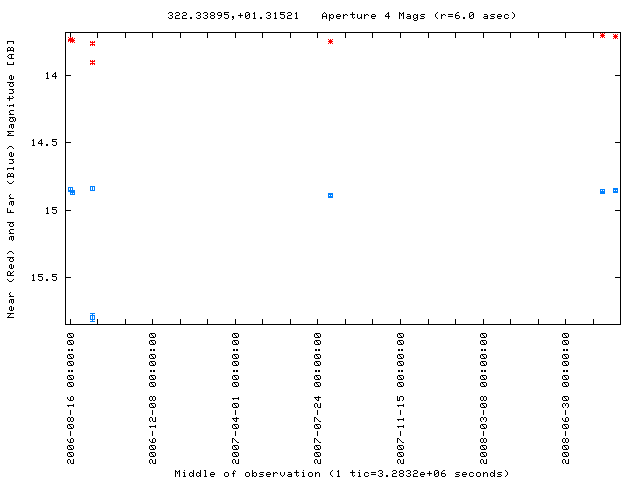
| 2008-09-06 | 322.33895 +01.31521 | 14.85 | 15.80 | 13.71 | 13.90 | GSC 00529-00555 | 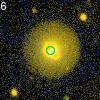 |
LC Plot |
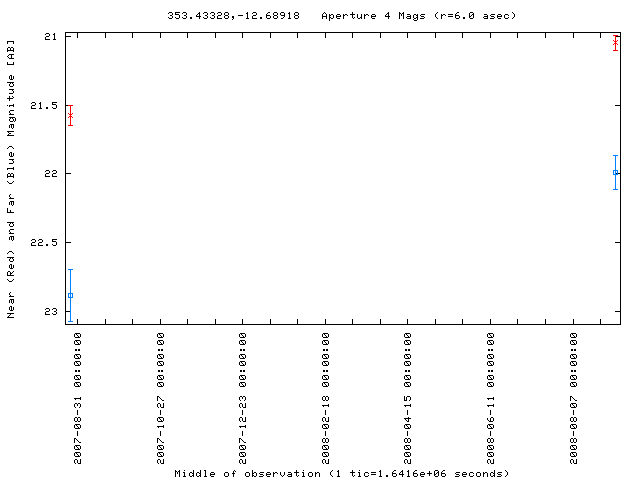
| 2008-09-05 | 353.43328 -12.68918 | 21.99 | 22.88 | 21.05 | 21.58 | - | 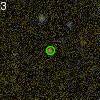 |
LC Plot |
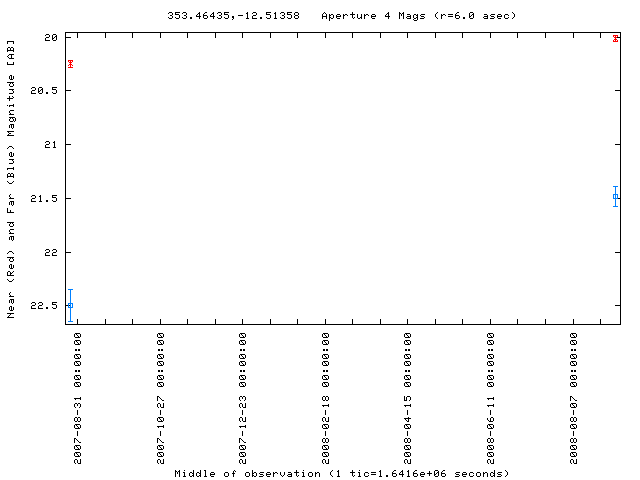
| 2008-09-05 | 353.46435 -12.51358 | 21.48 | 22.50 | 20.01 | 20.25 | - | 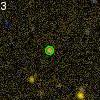 |
LC Plot |
| 2008-09-05 | 353.80476 -12.05888 | 21.73 | 22.72 | 19.89 | 20.20 | - | 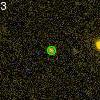 |
LC Plot |
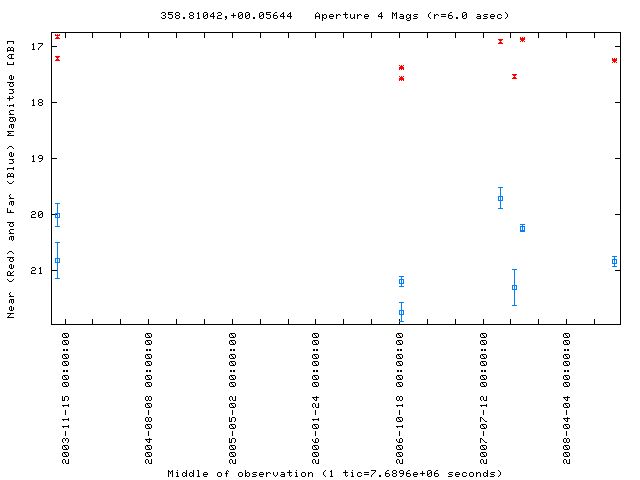
| 2008-09-04 | 358.81042 +00.05644 | 20.83 | 21.74 | 17.24 | 17.57 | HE 2352-0013 | 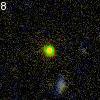 |
LC Plot |
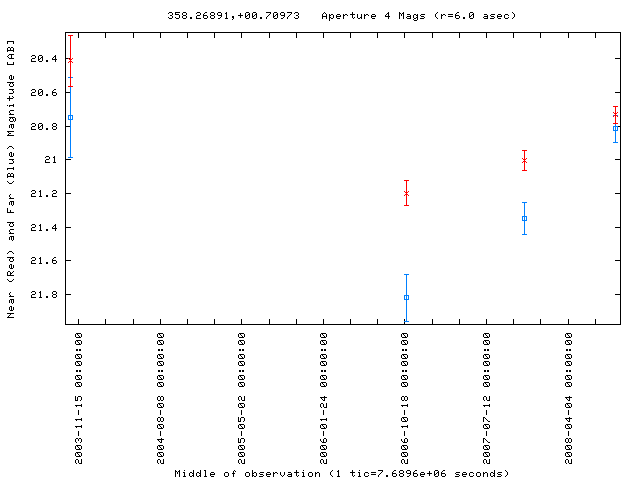
| 2008-09-04 | 358.26891 +00.70973 | 20.81 | 21.82 | 20.73 | 21.20 | APMUKS(BJ) B235030.66+002552.6 | 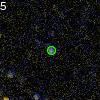 |
LC Plot |
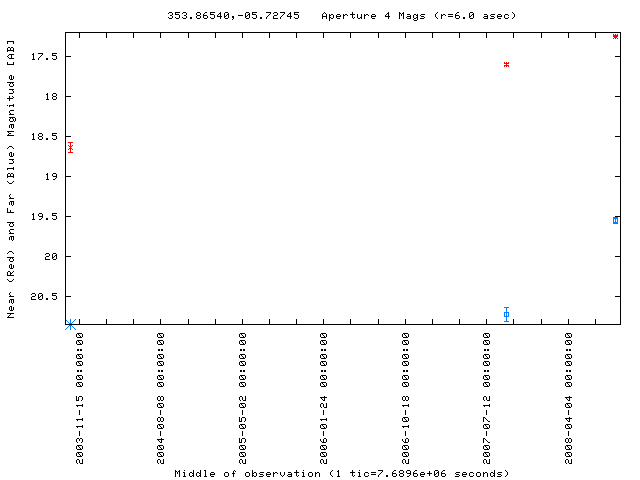
| 2008-09-04 | 353.86540 -05.72745 | 19.56 | 20.73 | 17.25 | 17.60 | HE 2332-0600 | 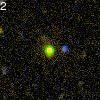 |
LC Plot |
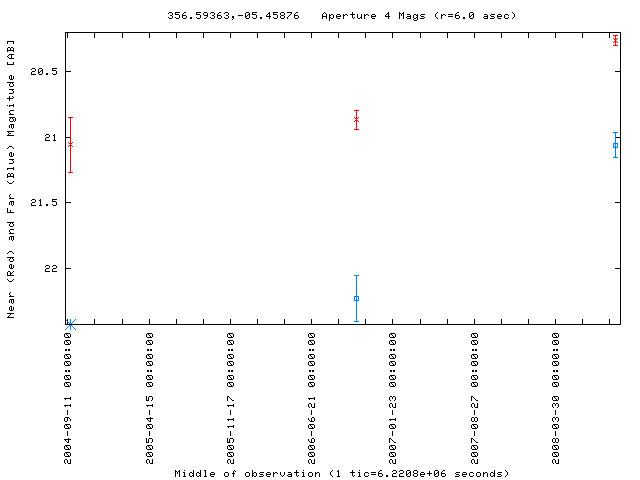
| 2008-09-04 | 356.59363 -05.45876 | 21.06 | 22.23 | 20.26 | 20.87 | - | 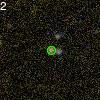 |
LC Plot |
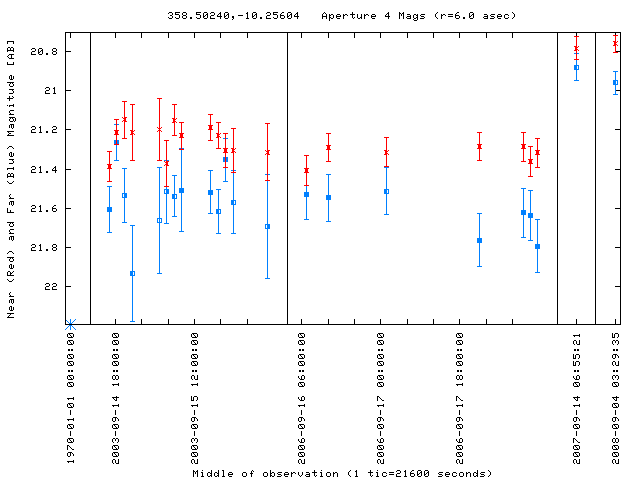
| 2008-09-04 | 358.50240 -10.25604 | 20.96 | 21.79 | 20.76 | 21.32 | - | 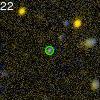 |
LC Plot |
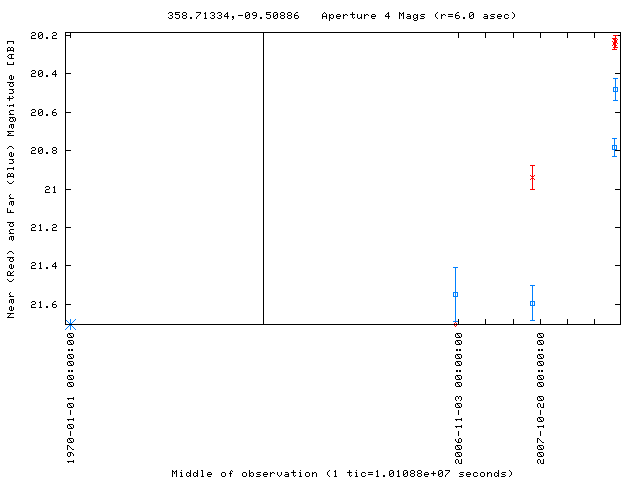
| 2008-09-04 | 358.71334 -09.50886 | 20.48 | 21.59 | 20.23 | 20.94 | SDSS J235451.23-093032.5 | 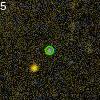 |
LC Plot |
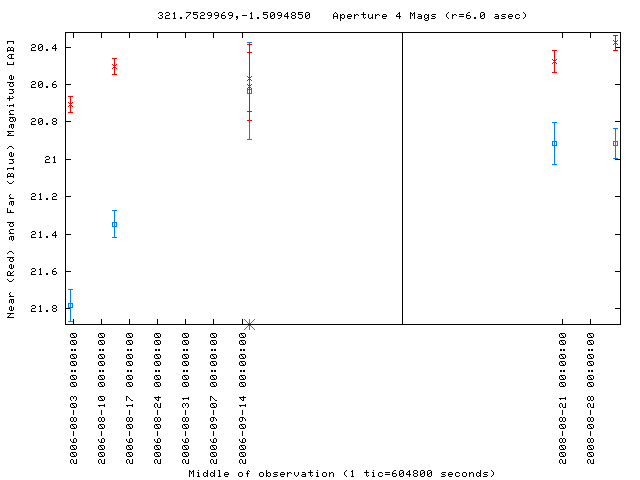
| 2008-09-03 | 321.75300 -01.50948 | 20.91 | 21.78 | 20.38 | 20.71 | - | 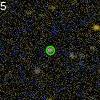 |
LC Plot |
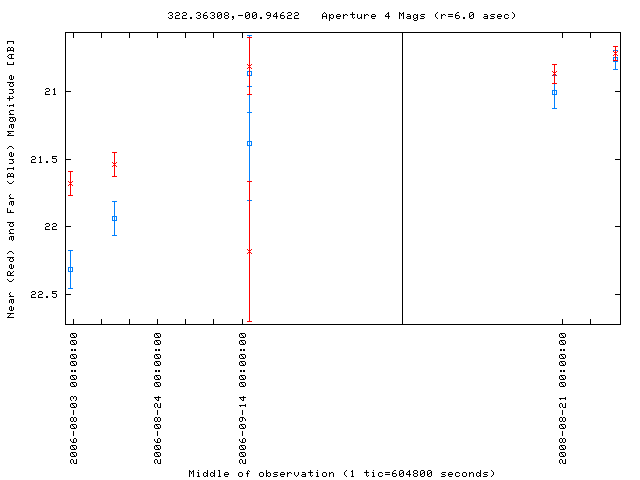
| 2008-09-03 | 322.36308 -00.94622 | 20.77 | 21.94 | 20.72 | 21.54 | SDSS J212927.14-005646.9 |  |
LC Plot |
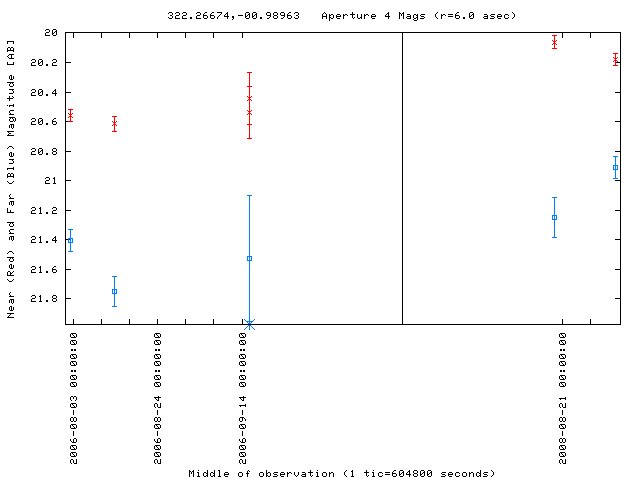
| 2008-09-03 | 322.26674 -00.98963 | 20.91 | 21.75 | 20.18 | 20.62 | SDSS J212903.99-005922.7 |  |
LC Plot |
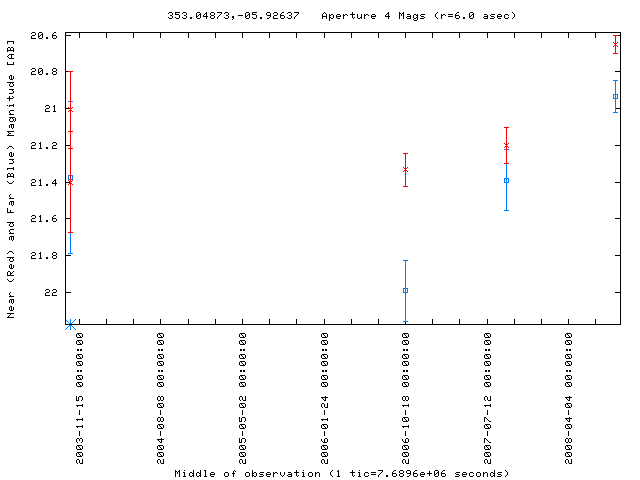
| 2008-09-03 | 353.04873 -05.92637 | 20.93 | 21.99 | 20.65 | 21.33 | - |  |
LC Plot |
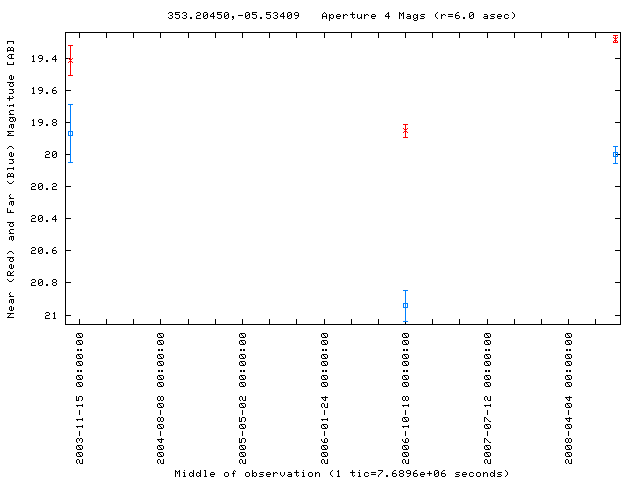
| 2008-09-03 | 353.20450 -05.53409 | 20.00 | 20.94 | 19.28 | 19.85 | GALEX 2666986433867155744 |  |
LC Plot |
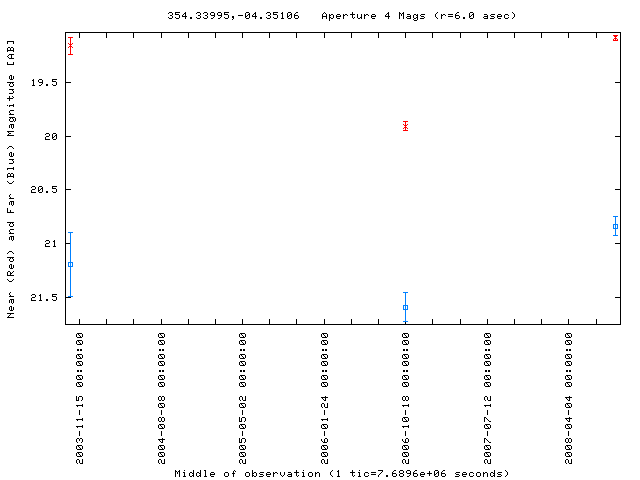
| 2008-09-02 | 354.33995 -04.35106 | 20.84 | 21.59 | 19.09 | 19.91 | - | 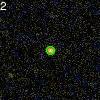 |
LC Plot |
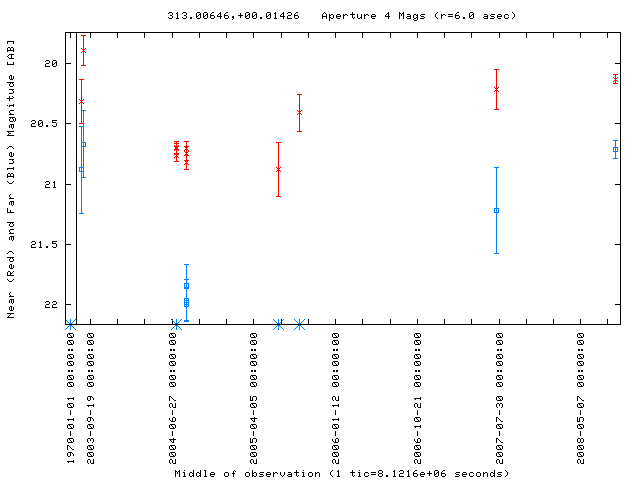
| 2008-09-02 | 313.00646 +00.01426 | 20.72 | 21.96 | 20.13 | 20.74 | SDSS J205201.61+000051.5 | 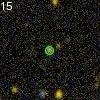 |
LC Plot |
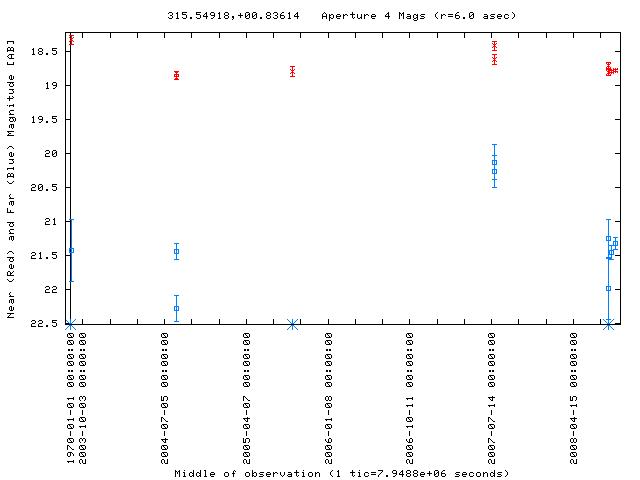
| 2008-09-02 | 315.54918 +00.83614 | 21.33 | 22.29 | 18.79 | 18.89 | - | 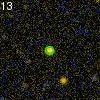 |
LC Plot |
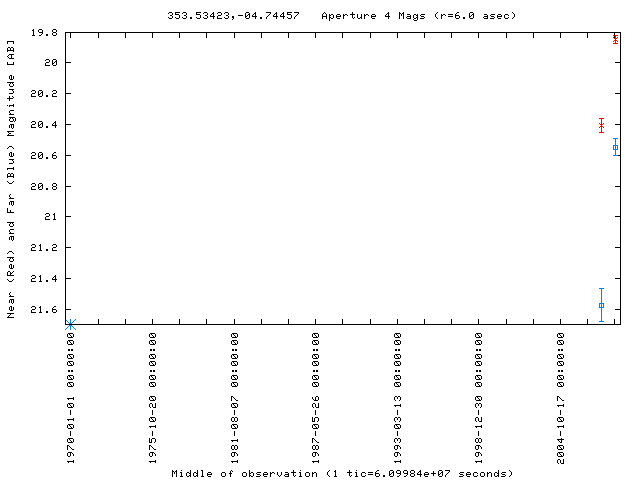
| 2008-09-01 | 353.53423 -04.74457 | 20.55 | 21.58 | 19.85 | 20.41 | - | 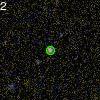 |
LC Plot |
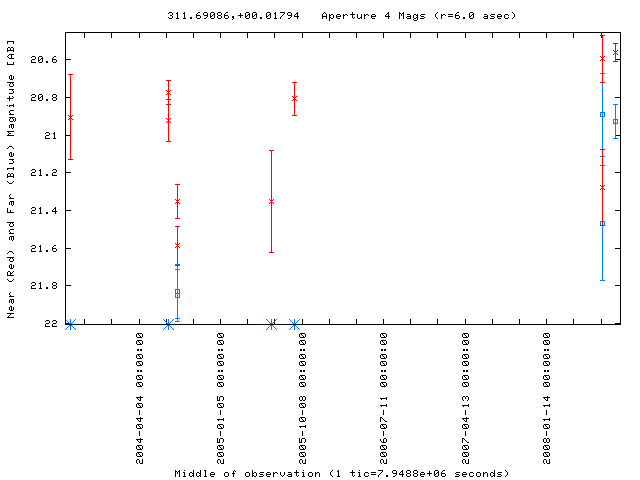
| 2008-09-01 | 311.69086 +00.01794 | 20.93 | 21.83 | 20.56 | 21.35 | - |  |
LC Plot |
Archive Navigation: Monthly Archive | Current

