

GALEX TDS Alerts Archive: Aug 2008
Archive Navigation: Montly Archive | Current
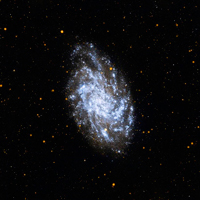
New GALEX observations are checked for variable sources every 24 hours by the GALEX science team. Alerts for validated variable sources will be posted on this page.
The GALEX variable alert notices from Aug, 2008 are listed below. Clicking the coordinates will perform a search of the SIMBAD database within 5 arseconds of the position. Clicking on the name of identified objects brings up the SIMBAD database entry for galactic objects and the NED database entry for extragalactic objects.
NOTES: GI data are not currently checked for variables.
DATE |
Coordinate (J2000) |
latest FUV |
earlier FUV |
latest NUV |
earlier NUV |
Identification |
NUV:FUV Cutout |
Light Curve |
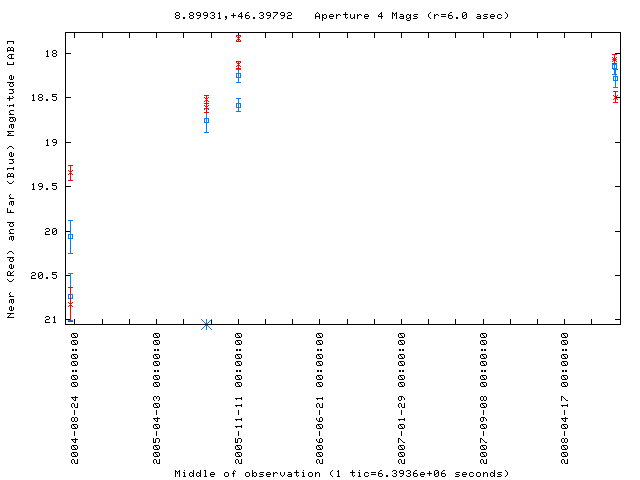
| 2008-08-31 | 8.89931 +46.39792 | 18.28 | 20.06 | 18.49 | 19.34 | - | 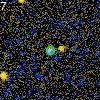 |
LC Plot |
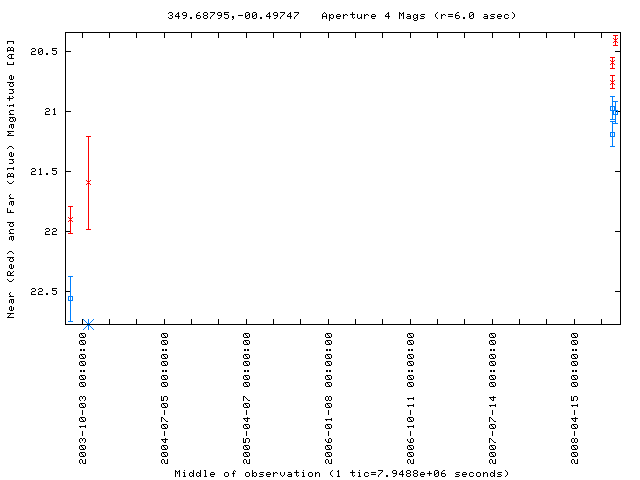
| 2008-08-31 | 349.68795 -00.49747 | 21.01 | 22.56 | 20.41 | 21.91 | SDSS J231845.12-002951.4 | 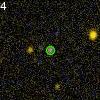 |
LC Plot |
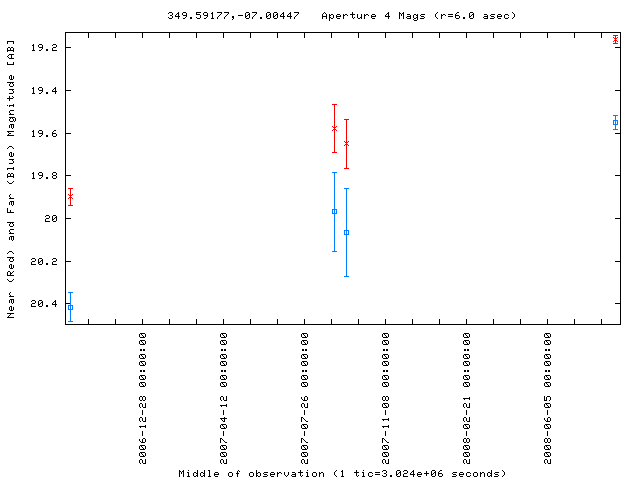
| 2008-08-31 | 349.59177 -07.00447 | 19.55 | 20.41 | 19.16 | 19.90 | - | 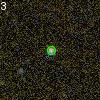 |
LC Plot |
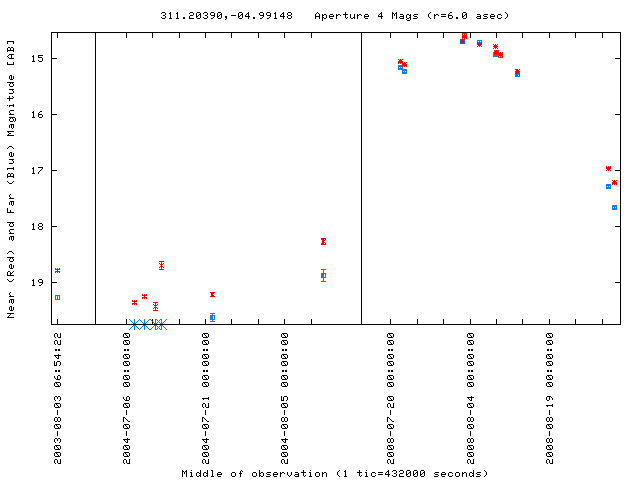
| 2008-08-31 | 311.20390 -04.99148 | 17.67 | 19.64 | 17.23 | 19.22 | SDSS J204448.92-045928.8 | 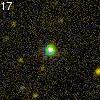 |
LC Plot |
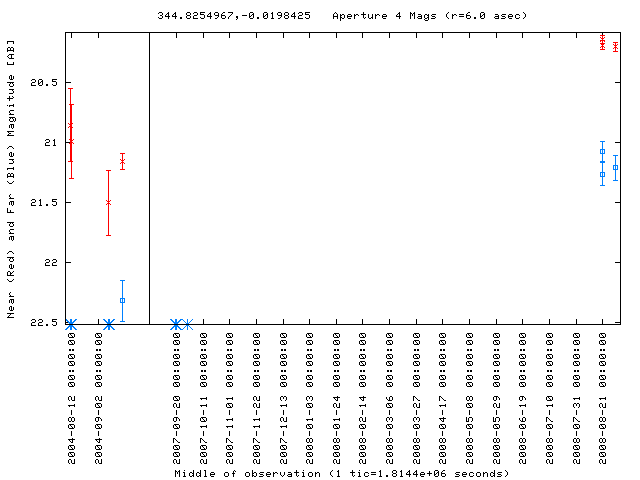
| 2008-08-30 | 344.82550 -00.01984 | 21.21 | 22.32 | 20.20 | 21.16 | SDSS J225918.16-000111.9 | 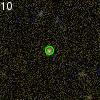 |
LC Plot |
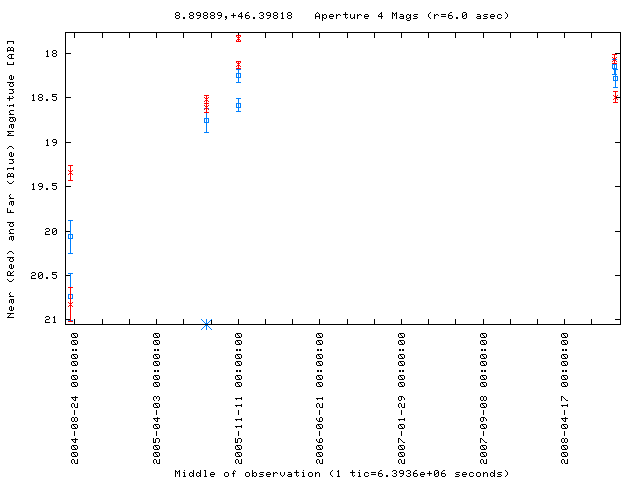
| 2008-08-30 | 8.89889 +46.39818 | 18.15 | 20.06 | 18.06 | 19.34 | - | 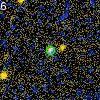 |
LC Plot |
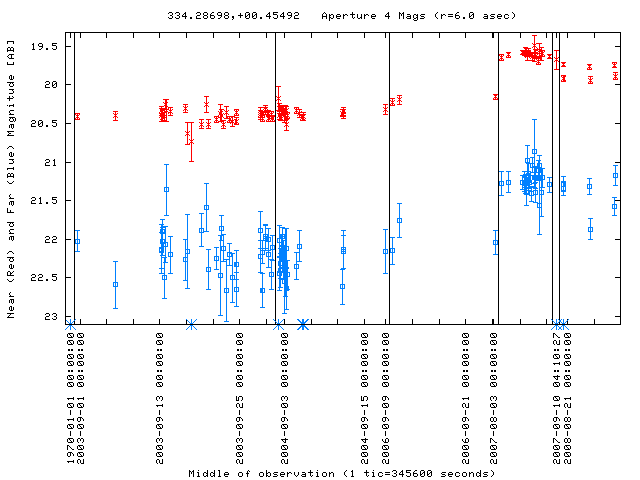
| 2008-08-28 | 334.28698 +00.45492 | 21.58 | 22.46 | 19.74 | 20.40 | SDSS J221708.83+002717.1 | 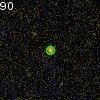 |
LC Plot |
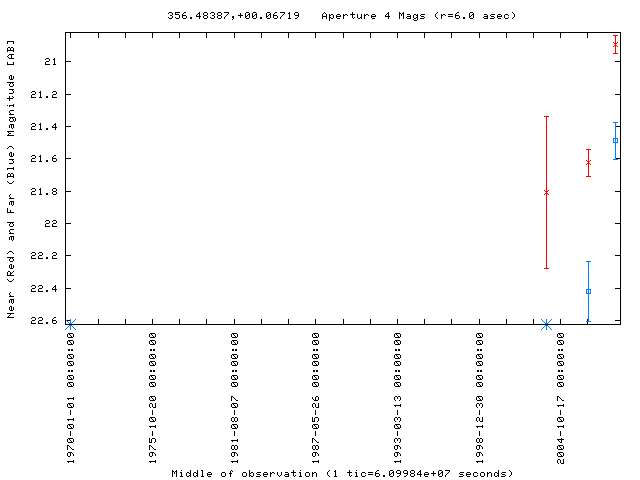
| 2008-08-27 | 356.48387 +00.06719 | 21.49 | 22.42 | 20.89 | 21.63 | SDSS J234556.13+000401.0 | 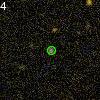 |
LC Plot |
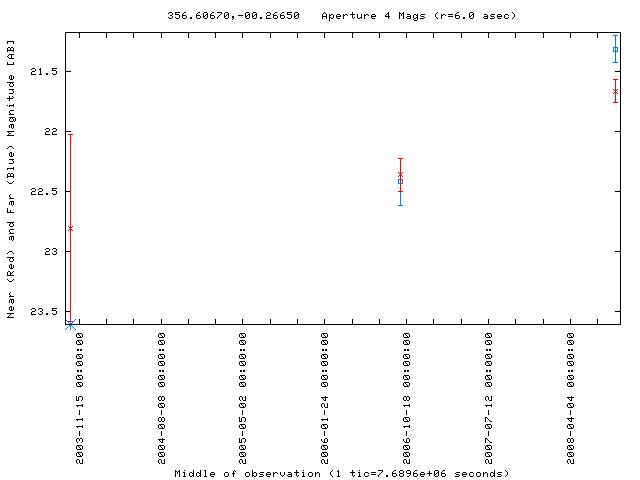
| 2008-08-27 | 356.60670 -00.26650 | 21.31 | 22.42 | 21.66 | 22.36 | SDSS J2346-0016 | 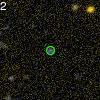 |
LC Plot |
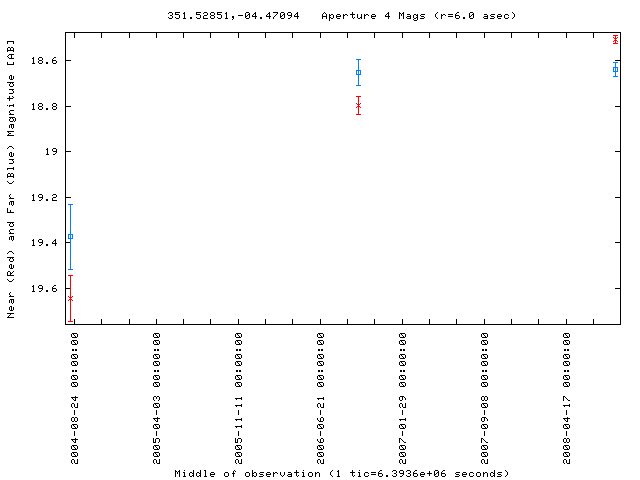
| 2008-08-27 | 351.52851 -04.47094 | 18.64 | 19.37 | 18.50 | 19.64 | - | 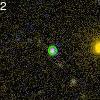 |
LC Plot |
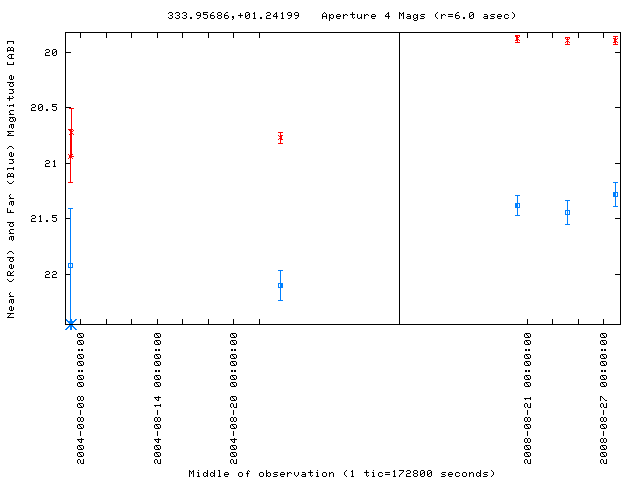
| 2008-08-27 | 333.95686 +01.24199 | 21.28 | 22.10 | 19.89 | 20.77 | GALEX 2470648944597669894 | 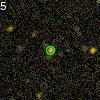 |
LC Plot |
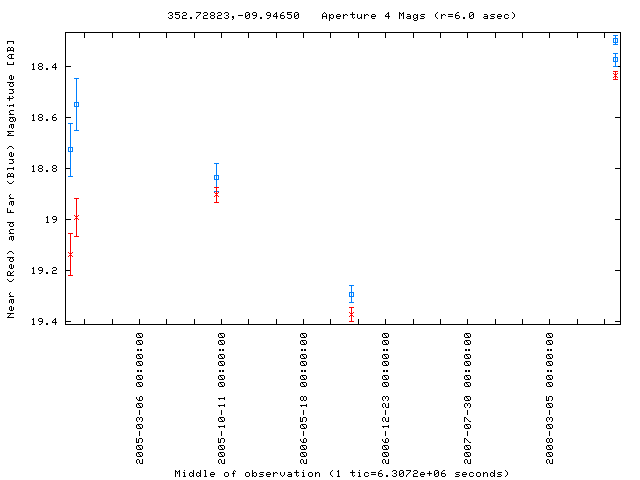
| 2008-08-26 | 352.72823 -09.94650 | 18.29 | 19.29 | 18.43 | 19.37 | 2MASX J23305473-0956479 | 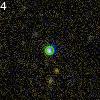 |
LC Plot |
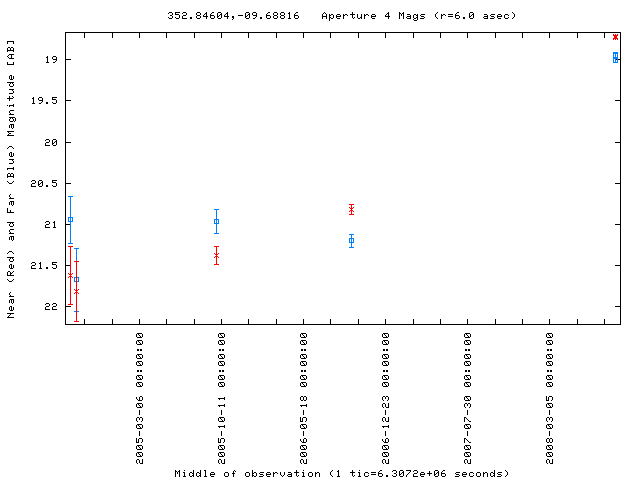
| 2008-08-26 | 352.84604 -09.68816 | 19.01 | 20.96 | 18.73 | 21.38 | - | 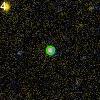 |
LC Plot |
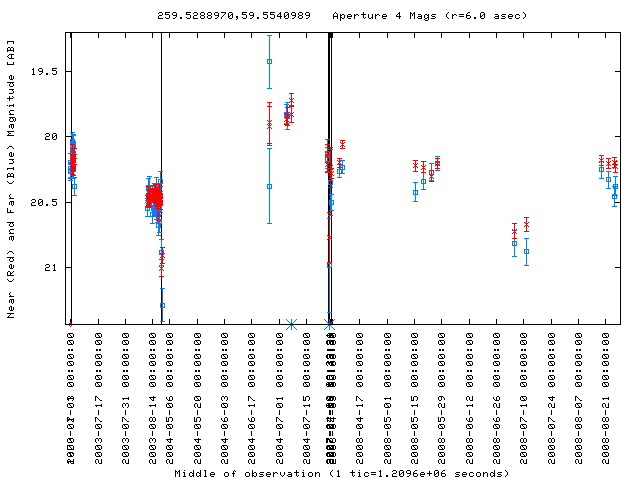
| 2008-08-25 | 259.52890 +59.55410 | 20.45 | 20.88 | 20.20 | 21.00 | SDSS J171806.84+593313.3 | 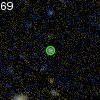 |
LC Plot |
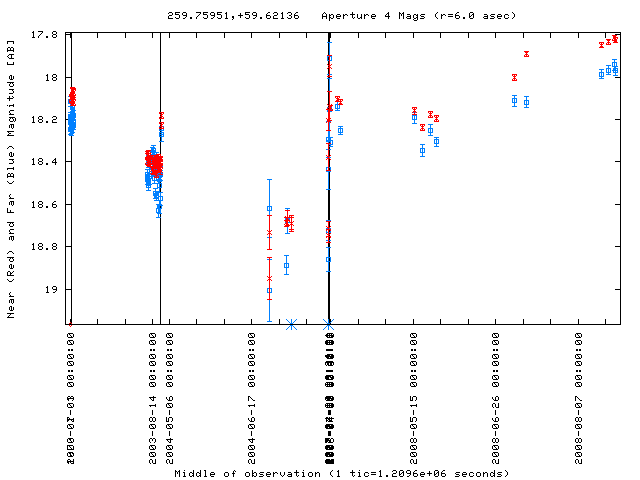
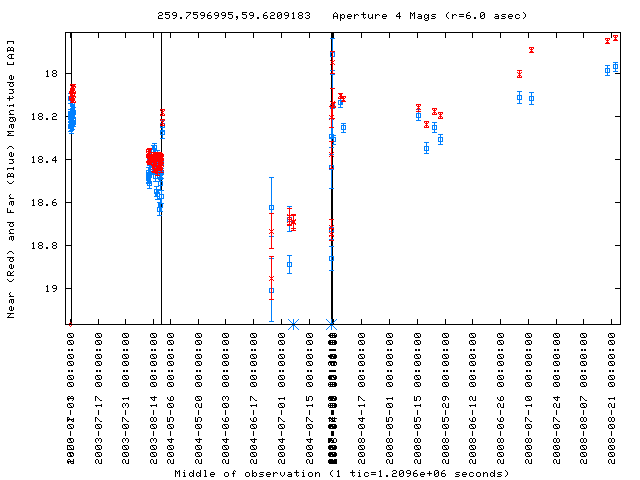
| 2008-08-25 | 259.75951 +59.62136 | 17.94 | 18.72 | 17.82 | 18.75 | SDSS J171902.28+593715.9 | 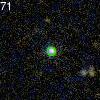 |
LC Plot |
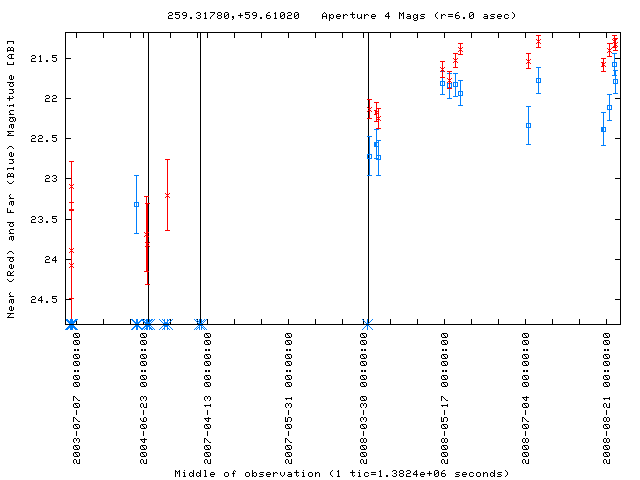
| 2008-08-25 | 259.31780 +59.61020 | 21.58 | 22.57 | 21.29 | 22.17 | SSTXFLS J171716.0+593635 | 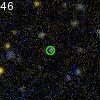 |
LC Plot |
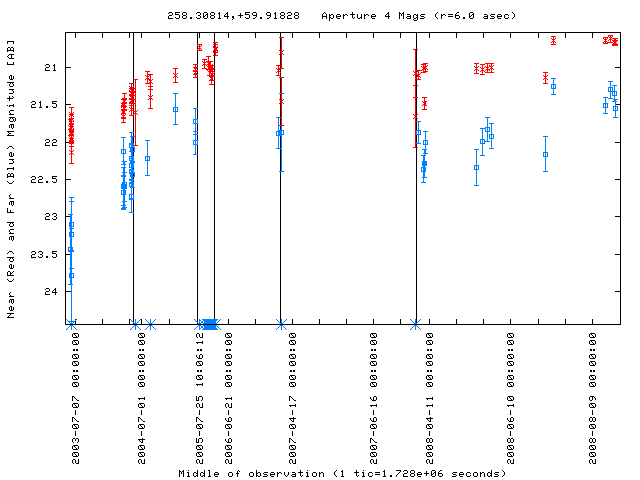
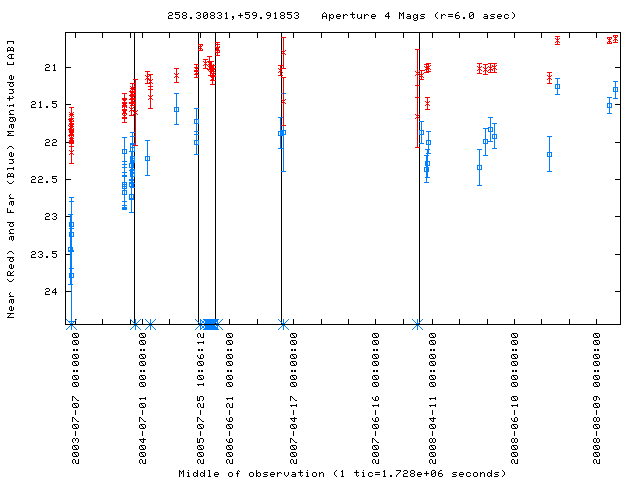
| 2008-08-25 | 258.30814 +59.91828 | 21.35 | 22.39 | 20.66 | 21.44 | SDSS J171313.88+595506.0 | 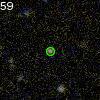 |
LC Plot |
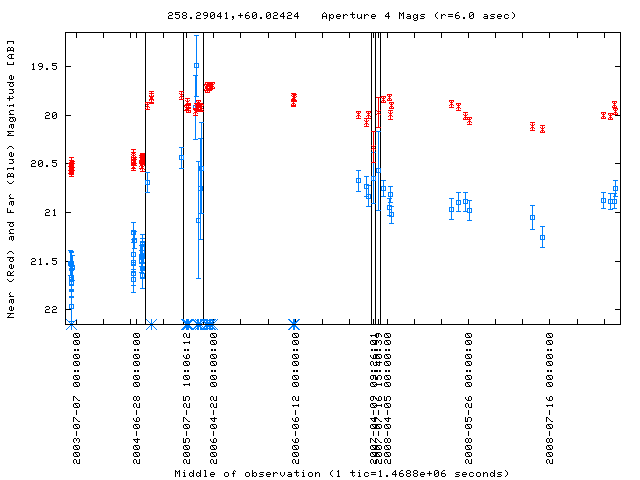
| 2008-08-25 | 258.29041 +60.02424 | 20.89 | 21.73 | 19.89 | 20.58 | SDSS J171309.58+600127.1 | 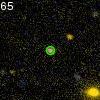 |
LC Plot |
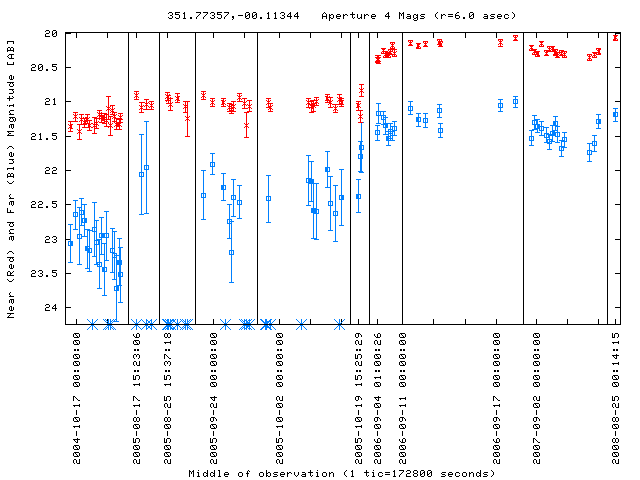
| 2008-08-25 | 351.77357 -00.11344 | 21.19 | 22.25 | 20.07 | 21.01 | SDSS J232705.65-000648.5 | 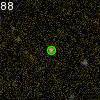 |
LC Plot |
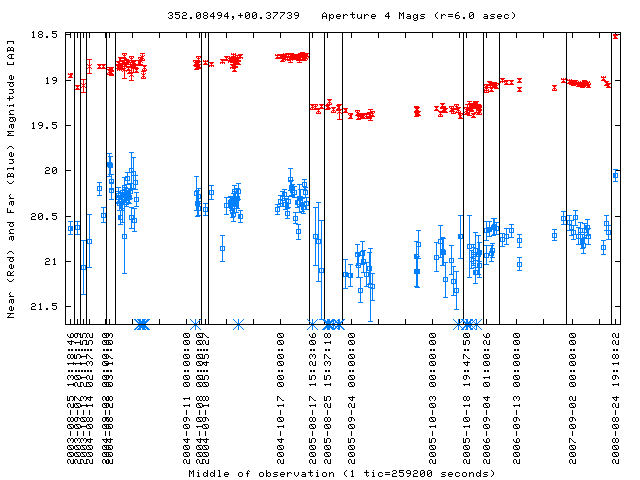
| 2008-08-24 | 352.08494 +00.37739 | 20.06 | 20.82 | 18.52 | 19.37 | SDSS J232820.37+002238.1 | 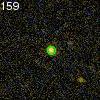 |
LC Plot |
| 2008-08-24 | 351.20140 +00.60993 | 20.75 | 21.60 | 19.42 | 19.99 | FBQS J2324+0036 | 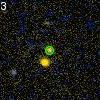 |
LC Plot |
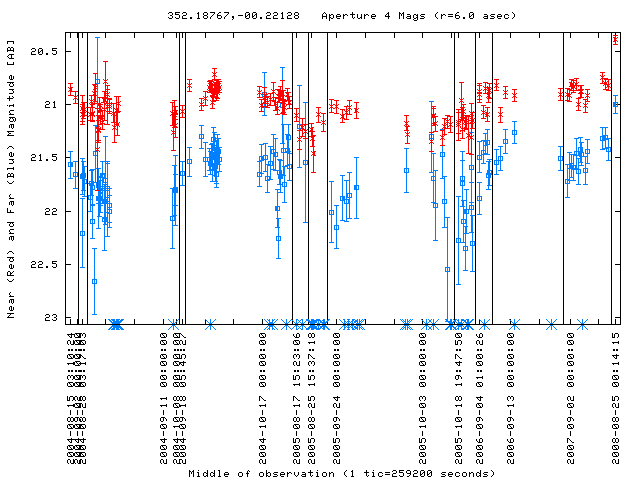
| 2008-08-25 | 352.18767 -00.22128 | 21.00 | 21.91 | 20.39 | 20.96 | GALEX 2417027961534283998 | 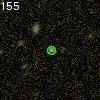 |
LC Plot |
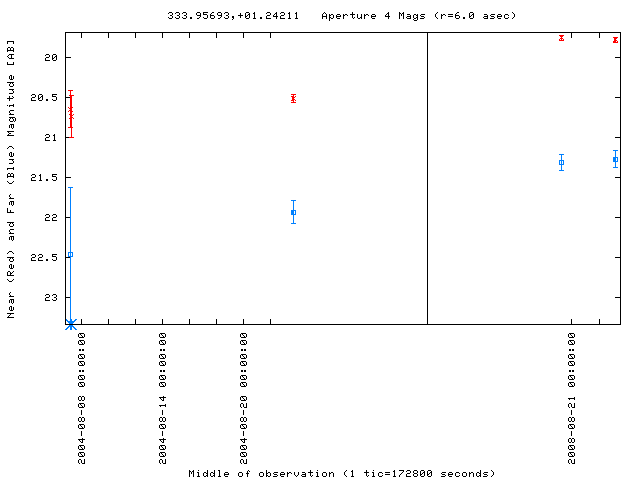
| 2008-08-24 | 333.95693 +01.24211 | 21.44 | 22.10 | 19.90 | 20.77 | GALEX 2470648944597669894 | 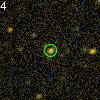 |
LC Plot |
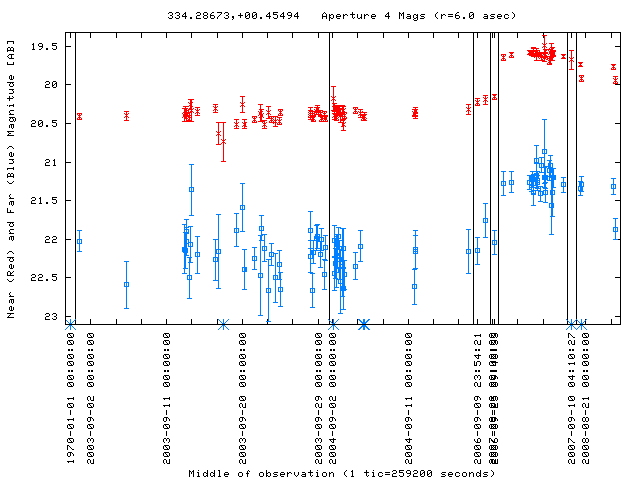
| 2008-08-24 | 334.28673 +00.45494 | 21.32 | 22.33 | 19.77 | 20.47 | SDSS J221708.83+002717.1 | 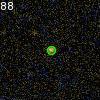 |
LC Plot |
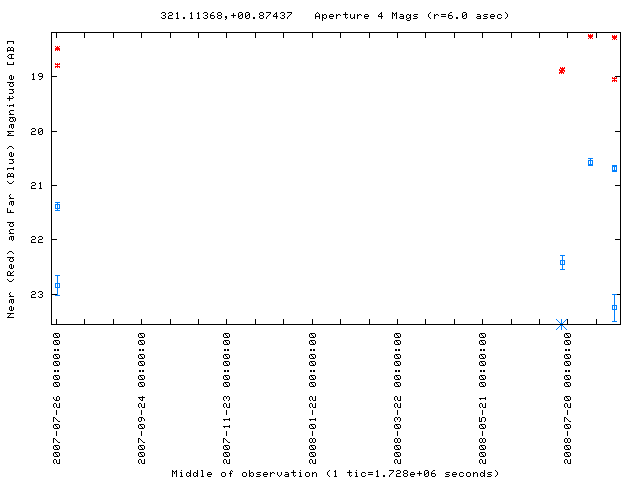
| 2008-08-22 | 321.11368 +00.87437 | 20.69 | 22.84 | 18.27 | 18.79 | - | 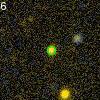 |
LC Plot |
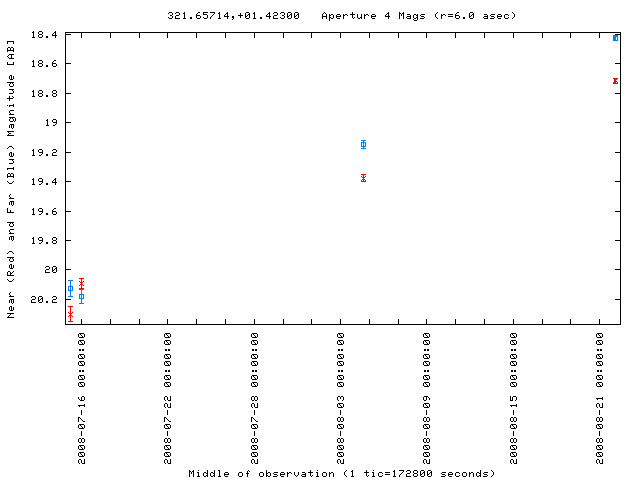
| 2008-08-22 | 321.65714 +01.42300 | 18.43 | 20.12 | 18.72 | 20.30 | - | 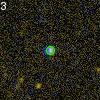 |
LC Plot |
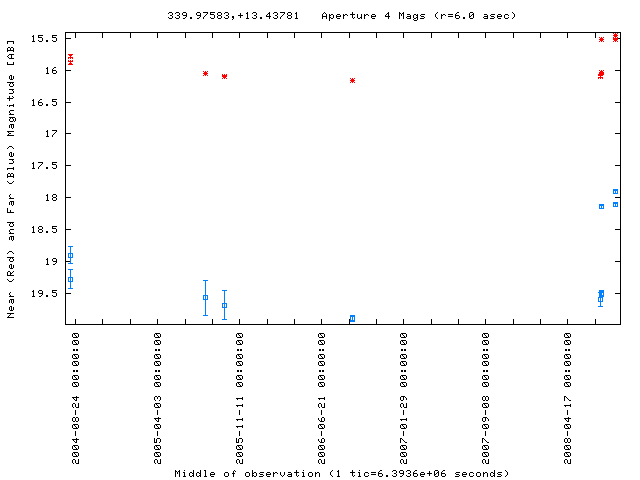
| 2008-08-22 | 339.97583 +13.43781 | 17.91 | 19.90 | 15.46 | 16.16 | - | 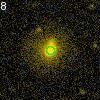 |
LC Plot |
| 2008-08-22 | 259.75970 +59.62092 | 17.97 | 18.72 | 17.83 | 18.75 | SDSS J171902.28+593715.9 | 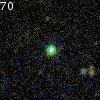 |
LC Plot |
| 2008-08-22 | 258.30831 +59.91853 | 21.30 | 22.43 | 20.62 | 21.41 | SDSS J171313.88+595506.0 | 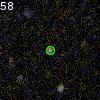 |
LC Plot |
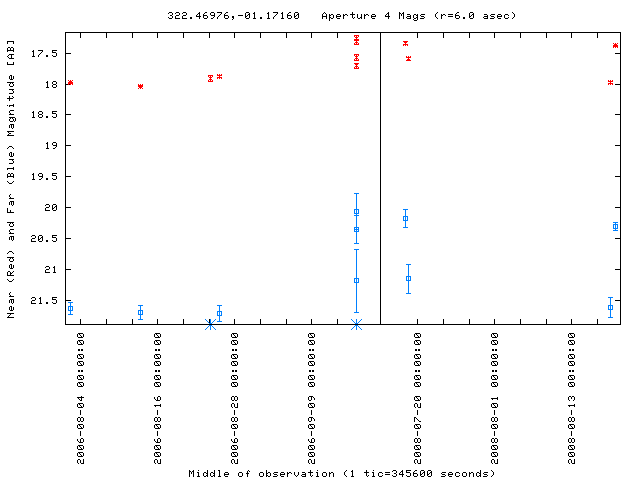
| 2008-08-19 | 322.46976 -01.17160 | 20.30 | 21.61 | 17.39 | 17.98 | - | 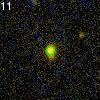 |
LC Plot |
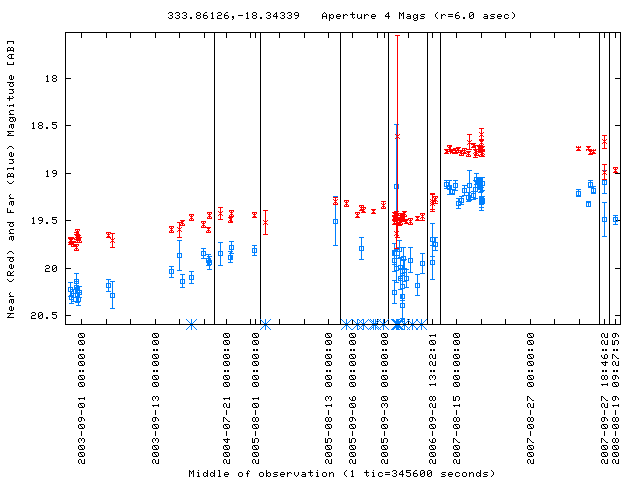
| 2008-08-19 | 333.86126 -18.34339 | 19.49 | 20.31 | 18.97 | 19.71 | - | 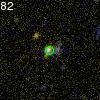 |
LC Plot |
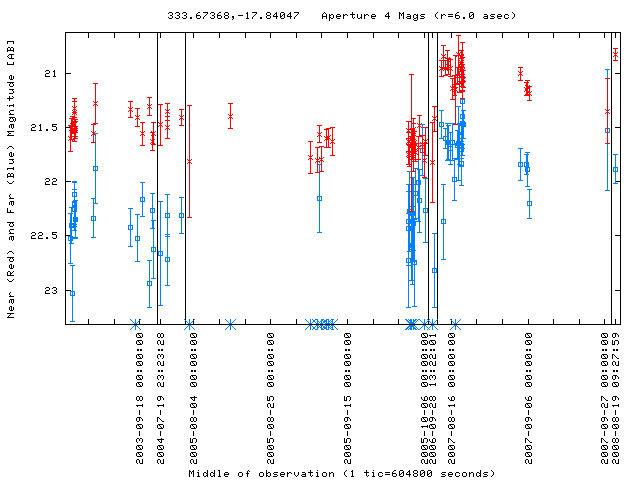
| 2008-08-19 | 333.67368 -17.84047 | 21.88 | 22.27 | 20.82 | 21.63 | - | 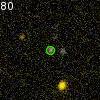 |
LC Plot |
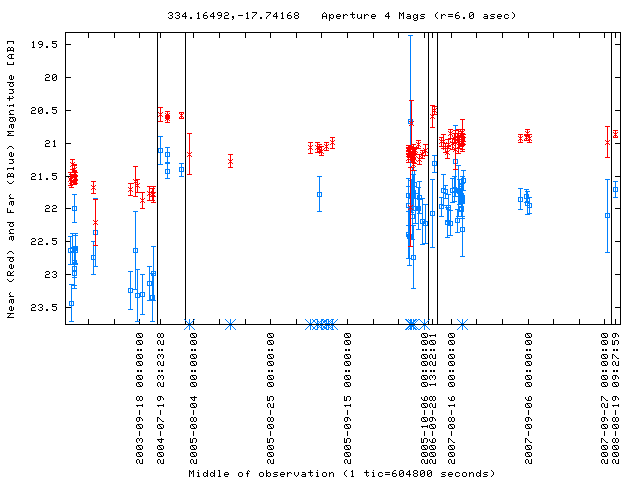
| 2008-08-19 | 334.16492 -17.74168 | 21.71 | 22.99 | 20.86 | 21.41 | - | 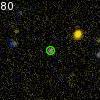 |
LC Plot |
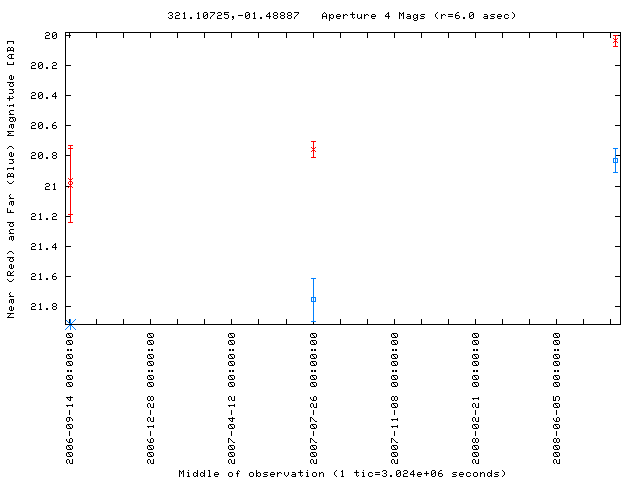
| 2008-08-19 | 321.10725 -01.48887 | 20.83 | 21.76 | 20.03 | 20.76 | - | 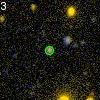 |
LC Plot |
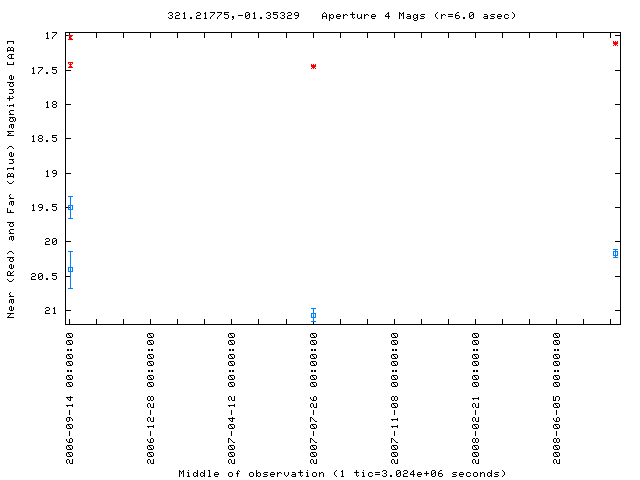
| 2008-08-19 | 321.21775 -01.35329 | 20.17 | 21.07 | 17.11 | 17.44 | - | 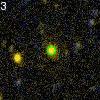 |
LC Plot |
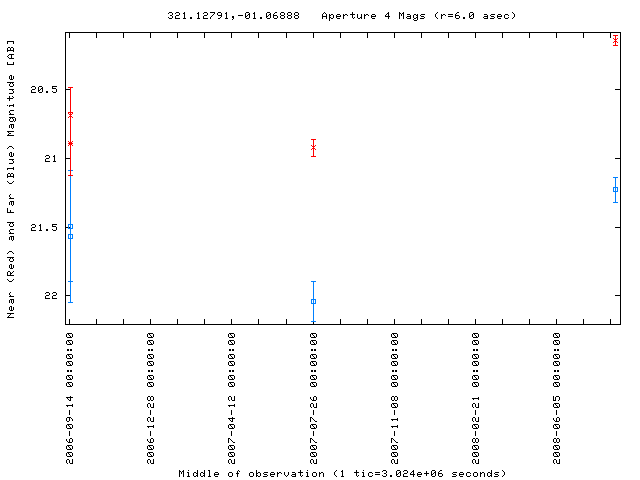
| 2008-08-19 | 321.12791 -01.06888 | 21.23 | 22.04 | 20.14 | 20.92 | - |  |
LC Plot |
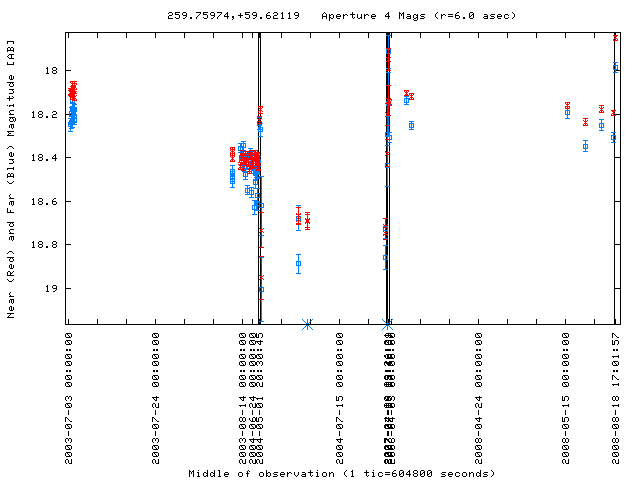
| 2008-08-18 | 259.75974 +59.62119 | 17.99 | 18.86 | 17.85 | 18.72 | SDSS J171902.28+593715.9 |  |
LC Plot |
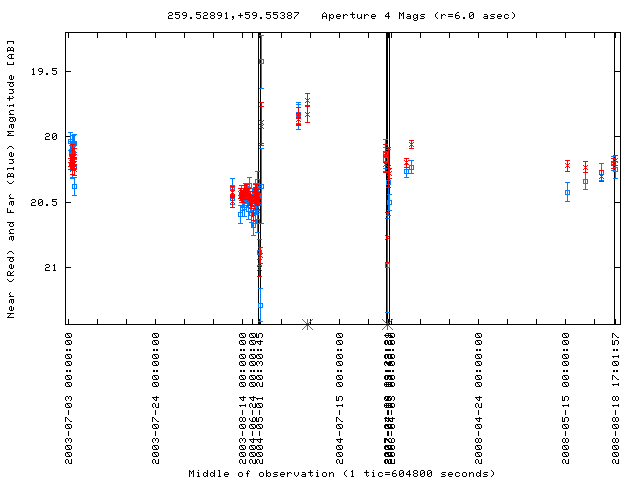
| 2008-08-18 | 259.52891 +59.55387 | 20.25 | 20.88 | 20.18 | 21.00 | SDSS J171806.84+593313.3 |  |
LC Plot |
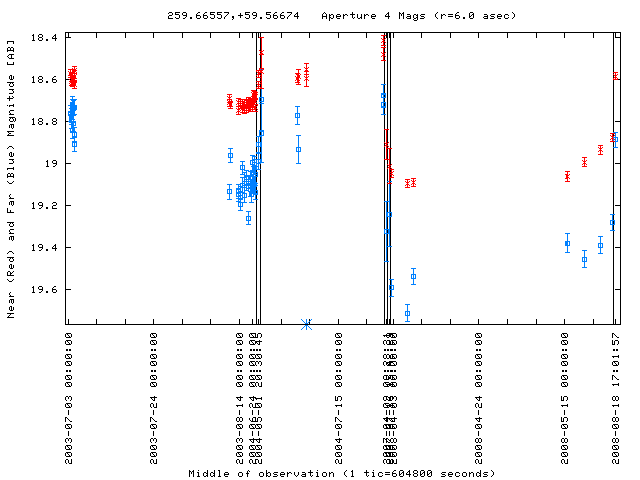
| 2008-08-18 | 259.66557 +59.56674 | 18.89 | 19.71 | 18.58 | 19.10 | SDSS J171839.74+593359.6 |  |
LC Plot |
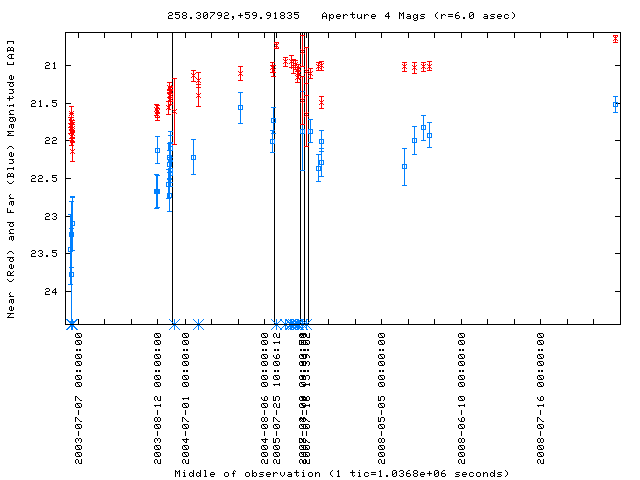
| 2008-08-18 | 258.30792 +59.91835 | 21.51 | 22.43 | 20.64 | 21.41 | SDSS J171313.88+595506.0 | 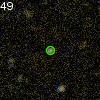 |
LC Plot |
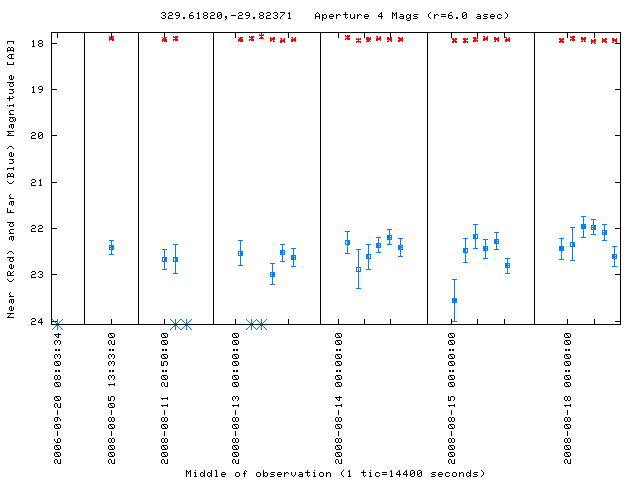
| 2008-08-18 | 329.61820 -29.82371 | 21.97 | 22.81 | 17.96 | 17.92 | - | 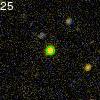 |
LC Plot |
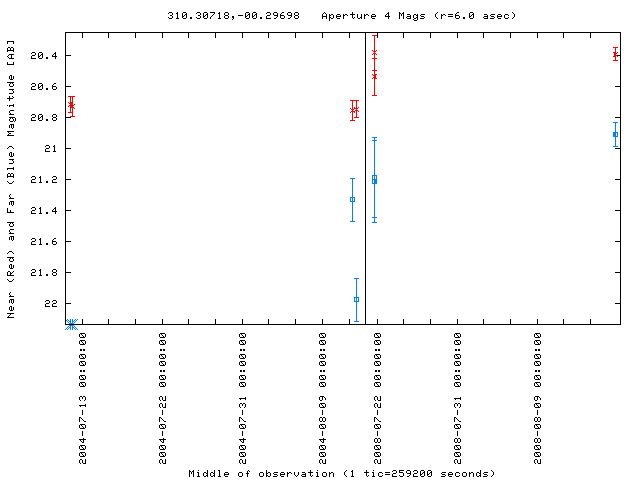
| 2008-08-17 | 310.30718 -00.29698 | 20.91 | 21.98 | 20.39 | 20.74 | SDSS J204113.70-001749.9 | 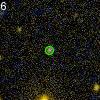 |
LC Plot |
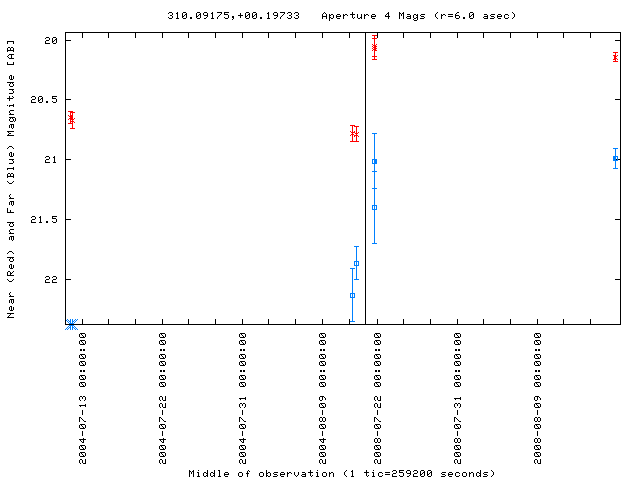
| 2008-08-17 | 310.09175 +00.19733 | 20.99 | 21.86 | 20.14 | 20.78 | SDSS J204021.97+001149.3 | 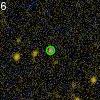 |
LC Plot |
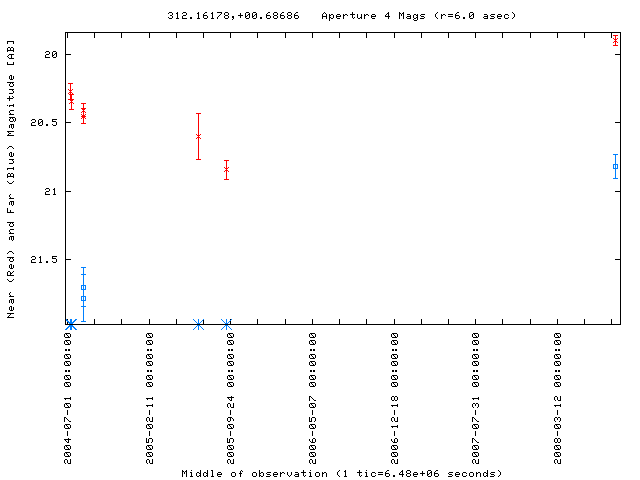
| 2008-08-17 | 312.16178 +00.68686 | 20.82 | 21.78 | 19.90 | 20.41 | SDSS J204838.82+004111.8 | 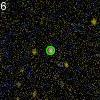 |
LC Plot |
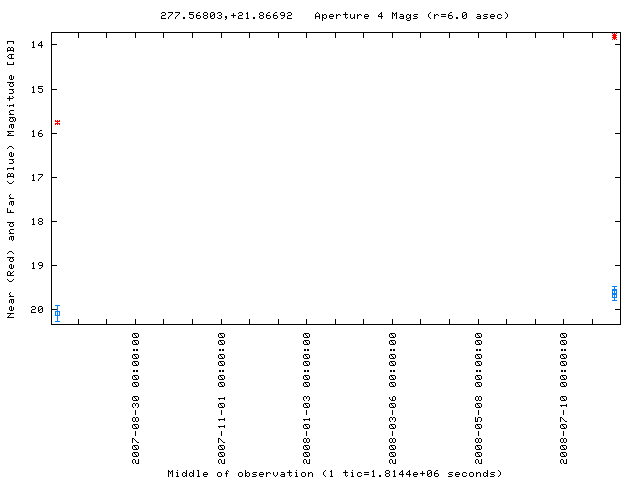
| 2008-08-16 | 277.56803 +21.86692 | 19.66 | 20.08 | 13.83 | 15.76 | V* AC Her | 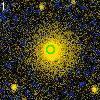 |
LC Plot |
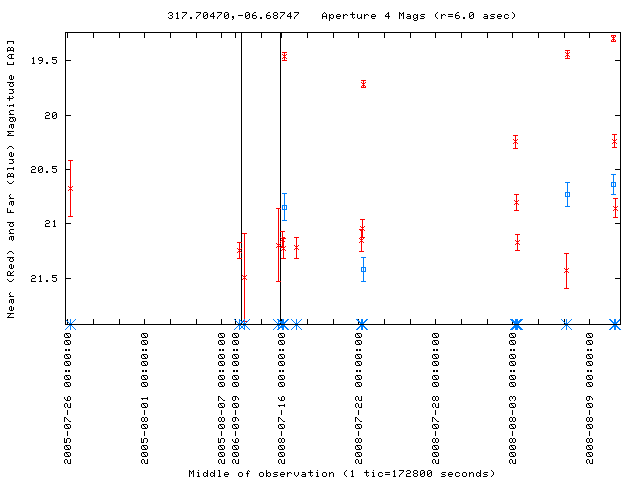
| 2008-08-10 | 317.70470 -06.68747 | 20.64 | 21.63 | 19.30 | 19.86 | - | 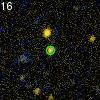 |
LC Plot |
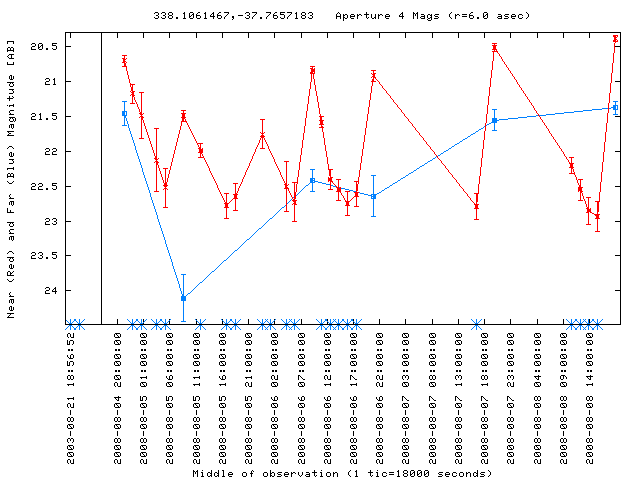
| 2008-08-07 | 338.10615 -37.76572 | 21.55 | 22.42 | 20.51 | 20.84 | - | 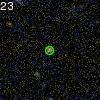 |
LC Plot |
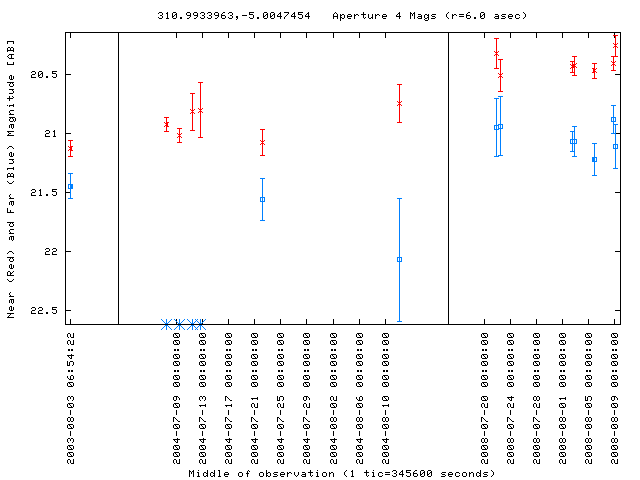
| 2008-08-09 | 310.99340 -05.00475 | 21.11 | 21.44 | 20.25 | 21.13 | - | 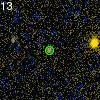 |
LC Plot |
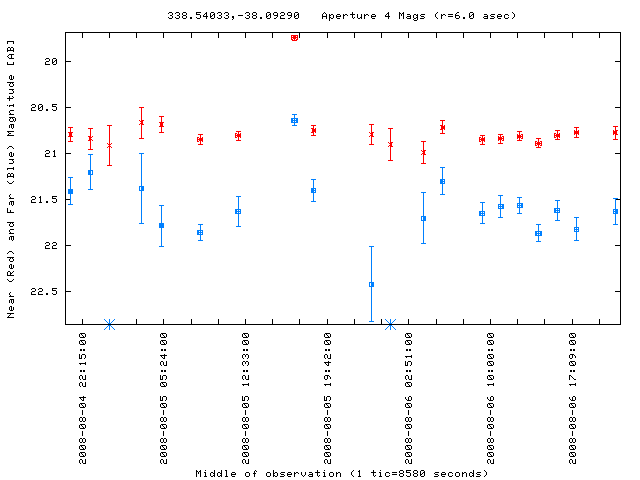
| 2008-08-05 | 338.54033 -38.09290 | 20.64 | 21.57 | 19.74 | 20.81 | B223116.38-382104.9 | 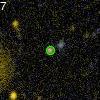 |
LC Plot |
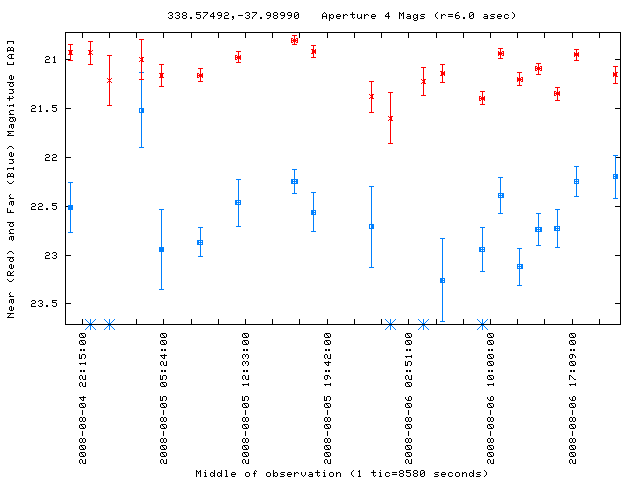
| 2008-08-05 | 338.57492 -37.98990 | 22.25 | 23.12 | 20.80 | 21.20 | - | 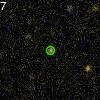 |
LC Plot |
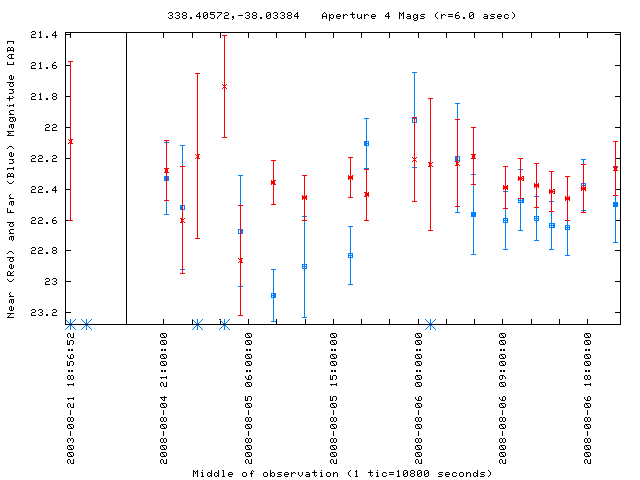
| 2008-08-05 | 338.40572 -38.03384 | 22.11 | 23.09 | 22.44 | 22.36 | - | 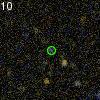 |
LC Plot |
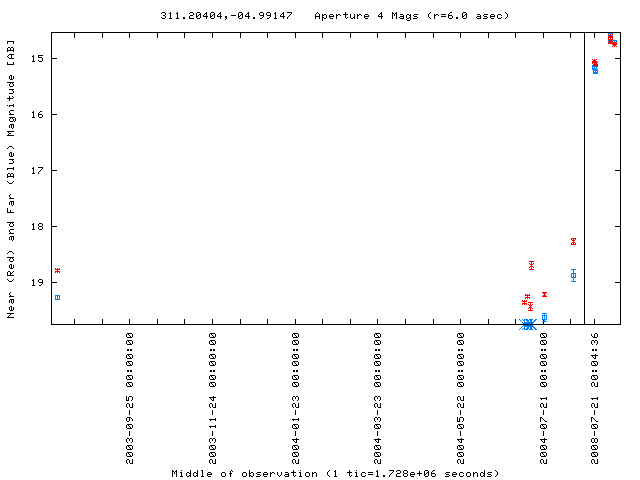
| 2008-08-05 | 311.20404 -04.99147 | 14.72 | 18.88 | 14.74 | 18.27 | SDSS J204448.92-045928.8 | 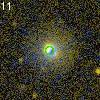 |
LC Plot |
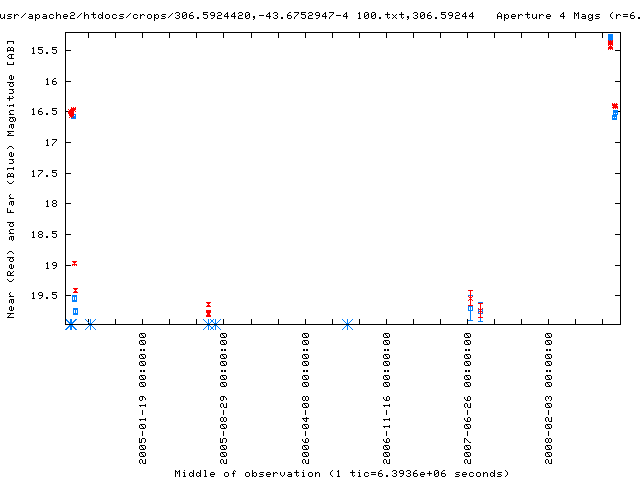
| 2008-08-05 | 306.59244 -43.67529 | 16.58 | 19.76 | 16.42 | 19.74 | V* V2276 Sgr | 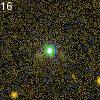 |
LC Plot |
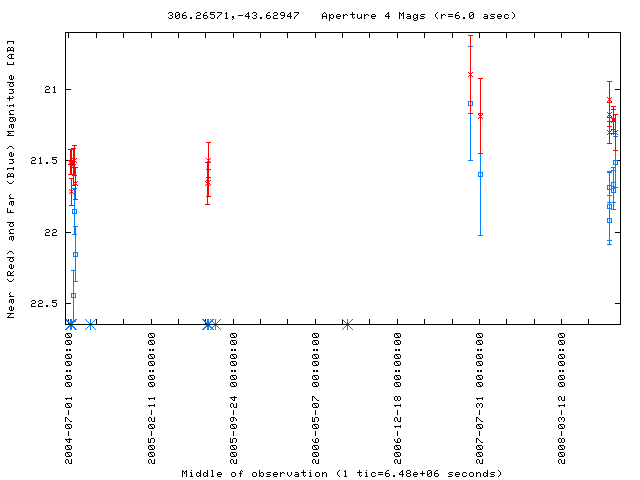
| 2008-08-05 | 306.26571 -43.62947 | 21.51 | 22.44 | 21.30 | 21.54 | - | 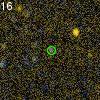 |
LC Plot |
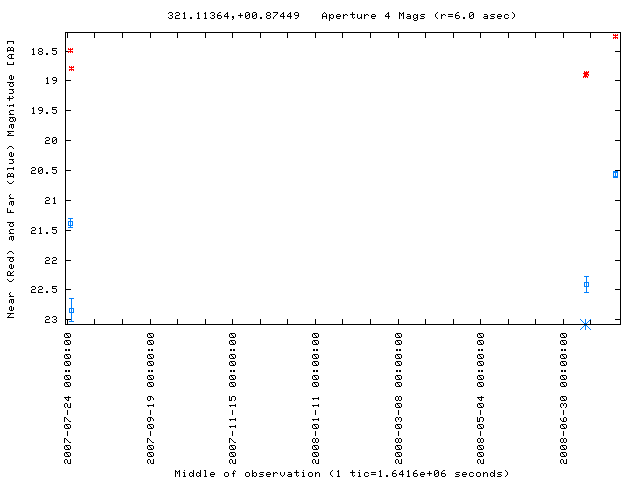
| 2008-08-04 | 321.11364 +00.87449 | 20.57 | 22.84 | 18.25 | 18.79 | - | 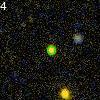 |
LC Plot |
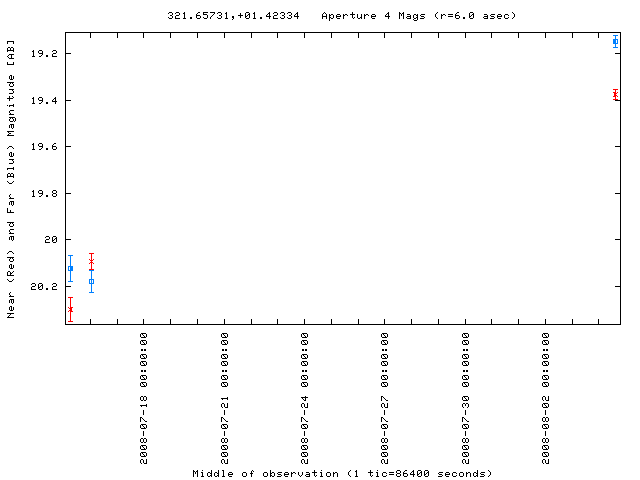
| 2008-08-04 | 321.65731 +01.42334 | 19.15 | 20.12 | 19.38 | 20.30 | - | 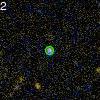 |
LC Plot |
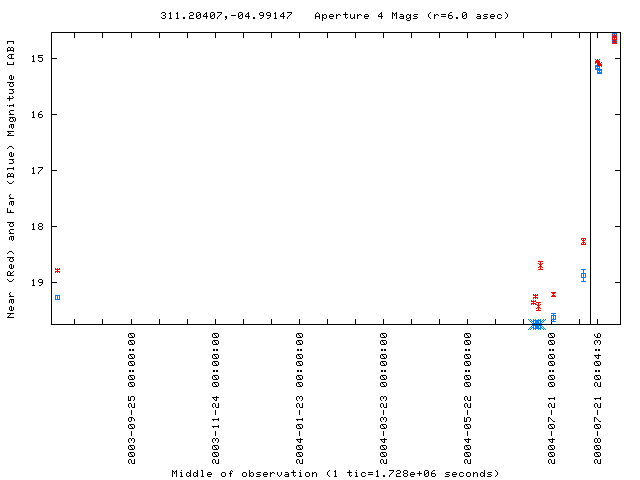
| 2008-08-02 | 311.20407 -04.99147 | 14.69 | 19.28 | 14.69 | 18.79 | SDSS J204448.92-045928.8 |  |
LC Plot |
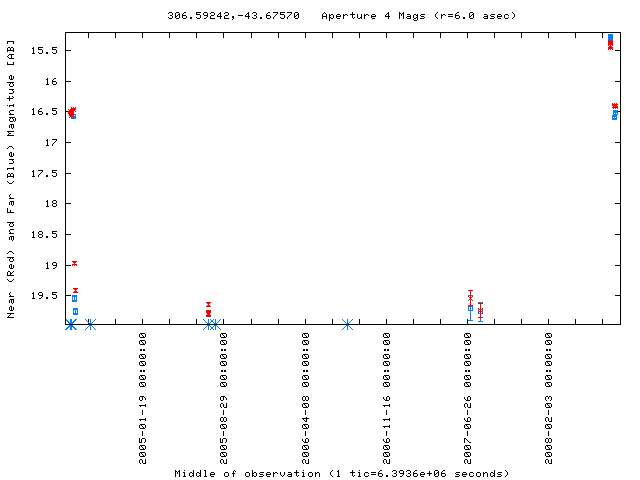
| 2008-08-02 | 306.59242 -43.67570 | 16.51 | 19.76 | 16.42 | 19.74 | V* V2276 Sgr |  |
LC Plot |
Archive Navigation: Montly Archive | Current

